29
/
en
AIzaSyAYiBZKx7MnpbEhh9jyipgxe19OcubqV5w
April 1, 2024
278723
Uzbekistan
UZB
true
2
1
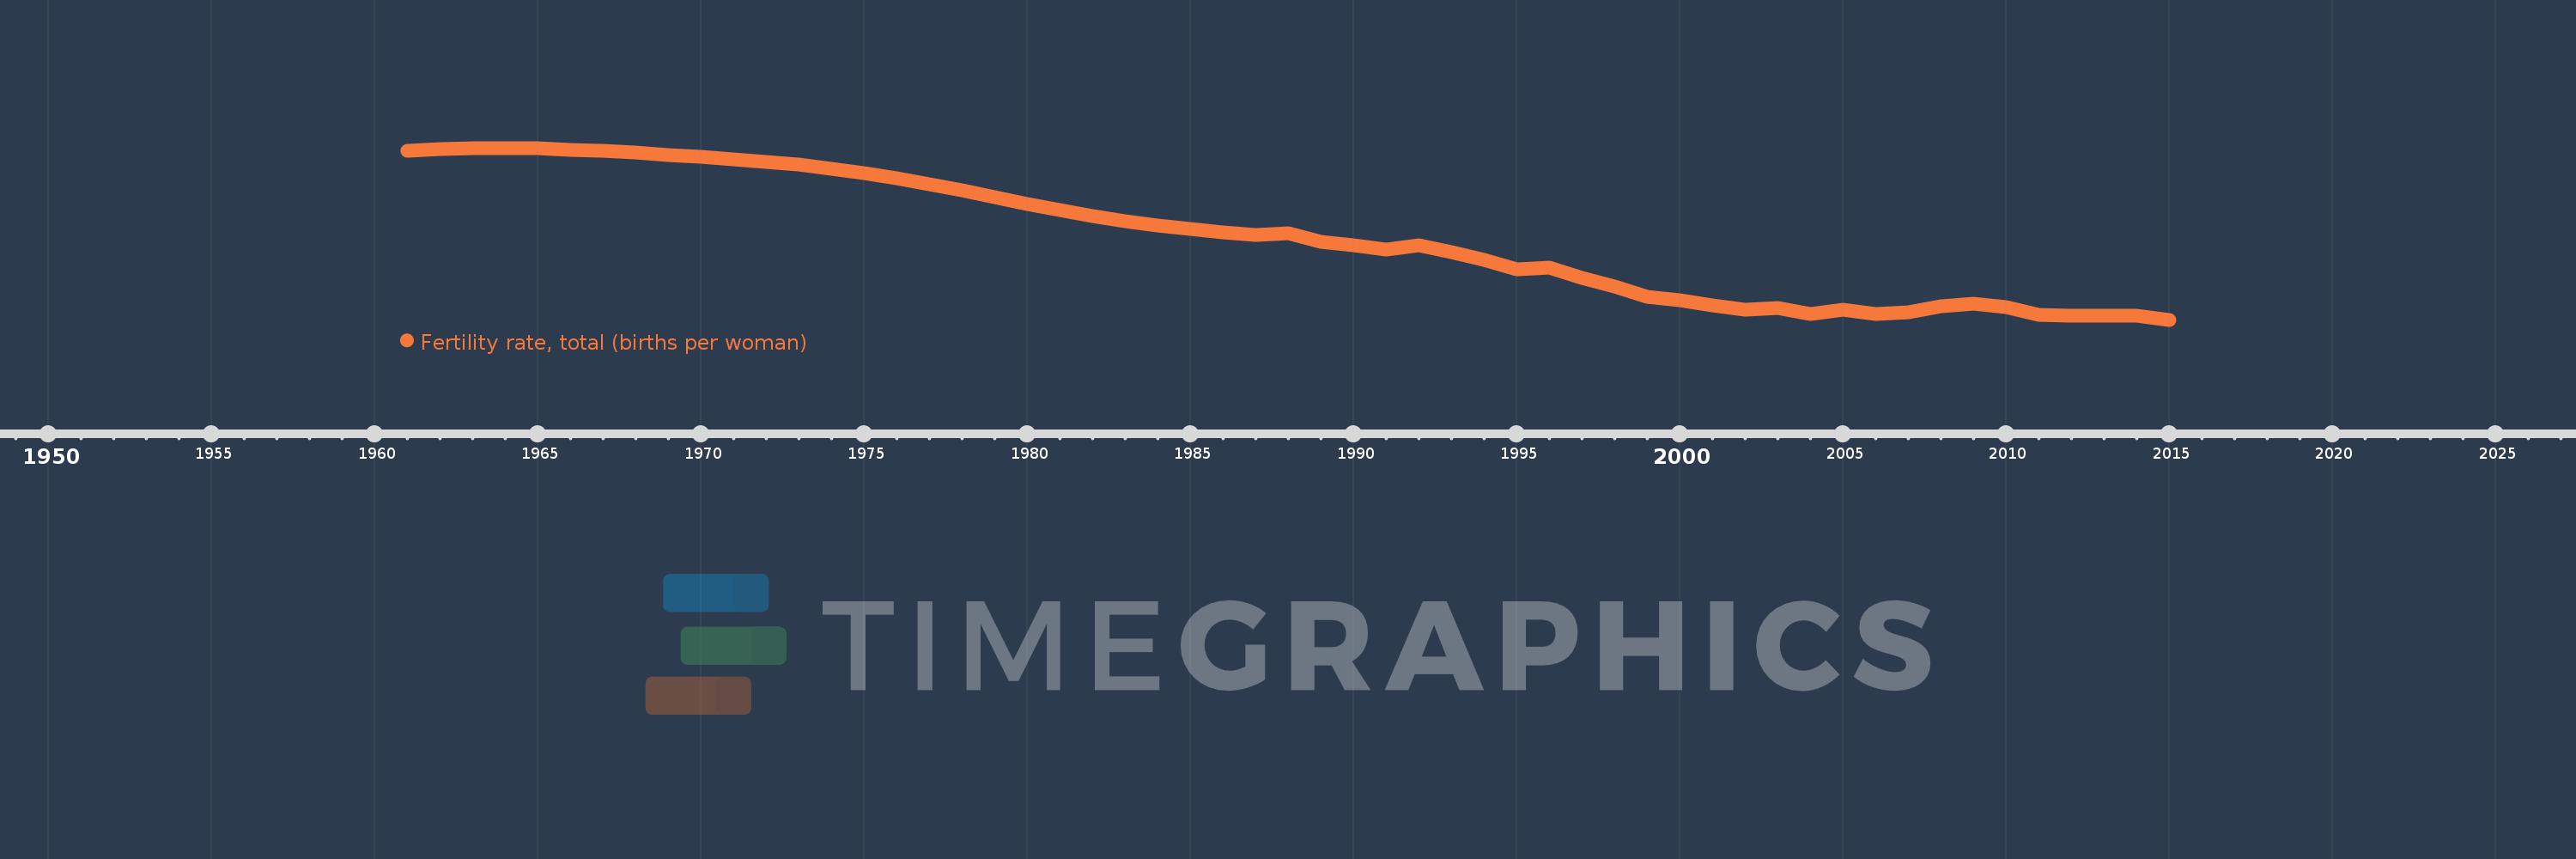
Fertility rate, total (births per woman)
2015,2014,2013,2012,2011,2010,2009,2008,2007,2006,2005,2004,2003,2002,2001,2000,1999,1998,1997,1996,1995,1994,1993,1992,1991,1990,1989,1988,1987,1986,1985,1984,1983,1982,1981,1980,1979,1978,1977,1976,1975,1974,1973,1972,1971,1970,1969,1968,1967,1966,1965,1964,1963,1962,1961
This statistics in other country:
AfghanistanAlbaniaAlgeriaAndorraAngolaAntigua and BarbudaArab WorldArgentinaArmeniaArubaAustraliaAustriaAzerbaijanBahamas, TheBahrainBangladeshBarbadosBelarusBelgiumBelizeBeninBermudaBhutanBoliviaBosnia and HerzegovinaBotswanaBrazilBrunei DarussalamBulgariaBurkina FasoBurundiCabo VerdeCambodiaCameroonCanadaCaribbean small statesCentral African RepublicCentral Europe and the BalticsChadChannel IslandsChileChinaColombiaComorosCongo, Dem. Rep.Congo, Rep.Costa RicaCote d'IvoireCroatiaCubaCuracaoCyprusCzech RepublicDenmarkDjiboutiDominicaDominican RepublicEarly-demographic dividendEast Asia & PacificEast Asia & Pacific (excluding high income)East Asia & Pacific (IDA & IBRD countries)EcuadorEgypt, Arab Rep.El SalvadorEquatorial GuineaEritreaEstoniaEthiopiaEuro areaEurope & Central AsiaEurope & Central Asia (excluding high income)Europe & Central Asia (IDA & IBRD countries)European UnionFaroe IslandsFijiFinlandFragile and conflict affected situationsFranceFrench PolynesiaGabonGambia, TheGeorgiaGermanyGhanaGreeceGreenlandGrenadaGuamGuatemalaGuineaGuinea-BissauGuyanaHaitiHeavily indebted poor countries (HIPC)High incomeHondurasHong Kong SAR, ChinaHungaryIBRD onlyIcelandIDA & IBRD totalIDA blendIDA onlyIDA totalIndiaIndonesiaIran, Islamic Rep.IraqIrelandIsle of ManIsraelItalyJamaicaJapanJordanKazakhstanKenyaKiribatiKorea, Dem. People’s Rep.Korea, Rep.KosovoKuwaitKyrgyz RepublicLao PDRLate-demographic dividendLatin America & Caribbean Latin America & Caribbean (excluding high income)Latin America & the Caribbean (IDA & IBRD countries)LatviaLeast developed countries: UN classificationLebanonLesothoLiberiaLibyaLiechtensteinLithuaniaLow & middle incomeLow incomeLower middle incomeLuxembourgMacao SAR, ChinaMacedonia, FYRMadagascarMalawiMalaysiaMaldivesMaliMaltaMarshall IslandsMauritaniaMauritiusMexicoMicronesia, Fed. Sts.Middle East & North AfricaMiddle East & North Africa (excluding high income)Middle East & North Africa (IDA & IBRD countries)Middle incomeMoldovaMongoliaMontenegroMoroccoMozambiqueMyanmarNamibiaNepalNetherlandsNew CaledoniaNew ZealandNicaraguaNigerNigeriaNorth AmericaNorwayOECD membersOmanOther small statesPacific island small statesPakistanPalauPanamaPapua New GuineaParaguayPeruPhilippinesPolandPortugalPost-demographic dividendPre-demographic dividendPuerto RicoQatarRomaniaRussian FederationRwandaSamoaSan MarinoSao Tome and PrincipeSaudi ArabiaSenegalSerbiaSeychellesSierra LeoneSingaporeSint Maarten (Dutch part)Slovak RepublicSloveniaSmall statesSolomon IslandsSomaliaSouth AfricaSouth AsiaSouth Asia (IDA & IBRD)South SudanSpainSri LankaSt. Kitts and NevisSt. LuciaSt. Martin (French part)St. Vincent and the GrenadinesSub-Saharan Africa Sub-Saharan Africa (excluding high income)Sub-Saharan Africa (IDA & IBRD countries)SudanSurinameSwazilandSwedenSwitzerlandSyrian Arab RepublicTajikistanTanzaniaThailandTimor-LesteTogoTongaTrinidad and TobagoTunisiaTurkeyTurkmenistanUgandaUkraineUnited Arab EmiratesUnited KingdomUnited StatesUpper middle incomeUruguayUzbekistanVanuatuVenezuela, RBVietnamVirgin Islands (U.S.)West Bank and GazaWorldYemen, Rep.ZambiaZimbabwe Timeline:
This timeline shows a graph from 1961 to 2015 of Uzbekistan. No data until 1960. Number of actual observations by date: 55.
Source name:
World Development Indicators
Source organization:
(1) United Nations Population Division. World Population Prospects, (2) Census reports and other statistical publications from national statistical offices, (3) Eurostat: Demographic Statistics, (4) United Nations Statistical Division. Population and Vital Statistics Reprot (various years), (5) U.S. Census Bureau: International Database, and (6) Secretariat of the Pacific Community: Statistics and Demography Programme.
Categories, topics:
Health, Gender
Last updated:
apr 23, 2017
Indicators value changes by year
At the date of observation
Value
Absolute change
Change from previous value
jan 1, 1961
6.707
+6.707
0.0%
jan 1, 1962
6.755
+0.048
0.72%
jan 1, 1963
6.783
+0.028
0.41%
jan 1, 1964
6.79
+0.007
0.1%
jan 1, 1965
6.777
-0.013
-0.19%
jan 1, 1966
6.748
-0.029
-0.43%
jan 1, 1967
6.707
-0.041
-0.61%
jan 1, 1968
6.66
-0.047
-0.7%
jan 1, 1969
6.608
-0.052
-0.78%
jan 1, 1970
6.552
-0.056
-0.85%
jan 1, 1971
6.492
-0.06
-0.92%
jan 1, 1972
6.422
-0.07
-1.08%
jan 1, 1973
6.338
-0.084
-1.31%
jan 1, 1974
6.237
-0.101
-1.59%
jan 1, 1975
6.119
-0.118
-1.89%
jan 1, 1976
5.983
-0.136
-2.22%
jan 1, 1977
5.829
-0.154
-2.57%
jan 1, 1978
5.66
-0.169
-2.9%
jan 1, 1979
5.482
-0.178
-3.14%
jan 1, 1980
5.302
-0.18
-3.28%
jan 1, 1981
5.127
-0.175
-3.3%
jan 1, 1982
4.968
-0.159
-3.1%
jan 1, 1983
4.829
-0.139
-2.8%
jan 1, 1984
4.711
-0.118
-2.44%
jan 1, 1985
4.616
-0.095
-2.02%
jan 1, 1986
4.539
-0.077
-1.67%
jan 1, 1987
4.474
-0.065
-1.43%
jan 1, 1988
4.5
+0.026
0.58%
jan 1, 1989
4.28
-0.22
-4.89%
jan 1, 1990
4.179
-0.101
-2.36%
jan 1, 1991
4.072
-0.107
-2.56%
jan 1, 1992
4.199
+0.127
3.12%
jan 1, 1993
4.004
-0.195
-4.64%
jan 1, 1994
3.8
-0.204
-5.09%
jan 1, 1995
3.537
-0.263
-6.92%
jan 1, 1996
3.596
+0.059
1.67%
jan 1, 1997
3.32
-0.276
-7.68%
jan 1, 1998
3.082
-0.238
-7.17%
jan 1, 1999
2.815
-0.267
-8.66%
jan 1, 2000
2.72
-0.095
-3.37%
jan 1, 2001
2.58
-0.14
-5.15%
jan 1, 2002
2.46
-0.12
-4.65%
jan 1, 2003
2.52
+0.06
2.44%
jan 1, 2004
2.36
-0.16
-6.35%
jan 1, 2005
2.46
+0.1
4.24%
jan 1, 2006
2.36
-0.1
-4.07%
jan 1, 2007
2.39
+0.03
1.27%
jan 1, 2008
2.55
+0.16
6.69%
jan 1, 2009
2.64
+0.09
3.53%
jan 1, 2010
2.53
-0.11
-4.17%
jan 1, 2011
2.34
-0.19
-7.51%
jan 1, 2012
2.3
-0.04
-1.71%
jan 1, 2015
2.2
-0.1
-4.35%
Ranking of countries by current statistics by years


Comments: