29
/
en
AIzaSyAYiBZKx7MnpbEhh9jyipgxe19OcubqV5w
April 1, 2024
177638
Lesotho
LSO
true
2
1
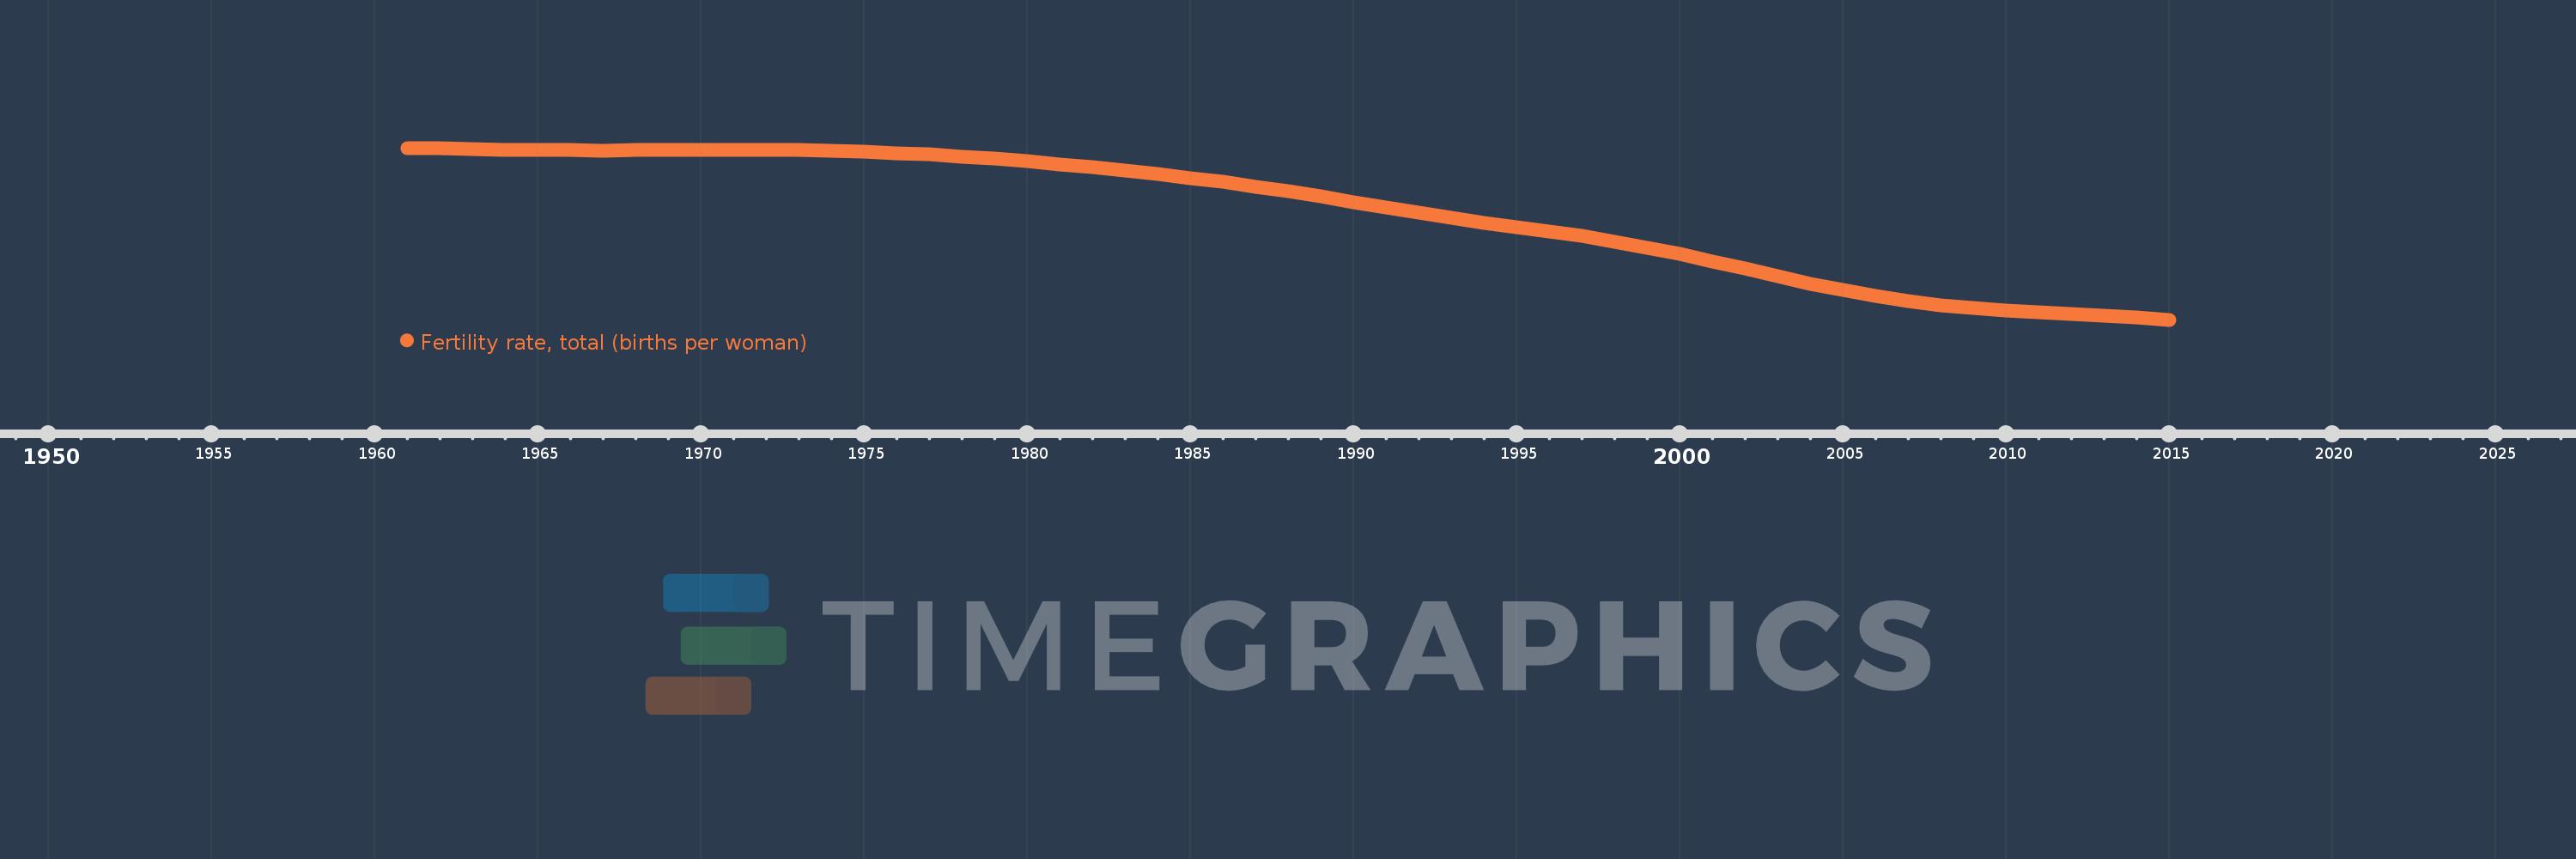
Fertility rate, total (births per woman)
2015,2014,2013,2012,2011,2010,2009,2008,2007,2006,2005,2004,2003,2002,2001,2000,1999,1998,1997,1996,1995,1994,1993,1992,1991,1990,1989,1988,1987,1986,1985,1984,1983,1982,1981,1980,1979,1978,1977,1976,1975,1974,1973,1972,1971,1970,1969,1968,1967,1966,1965,1964,1963,1962,1961
This statistics in other country:
AfghanistanAlbaniaAlgeriaAndorraAngolaAntigua and BarbudaArab WorldArgentinaArmeniaArubaAustraliaAustriaAzerbaijanBahamas, TheBahrainBangladeshBarbadosBelarusBelgiumBelizeBeninBermudaBhutanBoliviaBosnia and HerzegovinaBotswanaBrazilBrunei DarussalamBulgariaBurkina FasoBurundiCabo VerdeCambodiaCameroonCanadaCaribbean small statesCentral African RepublicCentral Europe and the BalticsChadChannel IslandsChileChinaColombiaComorosCongo, Dem. Rep.Congo, Rep.Costa RicaCote d'IvoireCroatiaCubaCuracaoCyprusCzech RepublicDenmarkDjiboutiDominicaDominican RepublicEarly-demographic dividendEast Asia & PacificEast Asia & Pacific (excluding high income)East Asia & Pacific (IDA & IBRD countries)EcuadorEgypt, Arab Rep.El SalvadorEquatorial GuineaEritreaEstoniaEthiopiaEuro areaEurope & Central AsiaEurope & Central Asia (excluding high income)Europe & Central Asia (IDA & IBRD countries)European UnionFaroe IslandsFijiFinlandFragile and conflict affected situationsFranceFrench PolynesiaGabonGambia, TheGeorgiaGermanyGhanaGreeceGreenlandGrenadaGuamGuatemalaGuineaGuinea-BissauGuyanaHaitiHeavily indebted poor countries (HIPC)High incomeHondurasHong Kong SAR, ChinaHungaryIBRD onlyIcelandIDA & IBRD totalIDA blendIDA onlyIDA totalIndiaIndonesiaIran, Islamic Rep.IraqIrelandIsle of ManIsraelItalyJamaicaJapanJordanKazakhstanKenyaKiribatiKorea, Dem. People’s Rep.Korea, Rep.KosovoKuwaitKyrgyz RepublicLao PDRLate-demographic dividendLatin America & Caribbean Latin America & Caribbean (excluding high income)Latin America & the Caribbean (IDA & IBRD countries)LatviaLeast developed countries: UN classificationLebanonLesothoLiberiaLibyaLiechtensteinLithuaniaLow & middle incomeLow incomeLower middle incomeLuxembourgMacao SAR, ChinaMacedonia, FYRMadagascarMalawiMalaysiaMaldivesMaliMaltaMarshall IslandsMauritaniaMauritiusMexicoMicronesia, Fed. Sts.Middle East & North AfricaMiddle East & North Africa (excluding high income)Middle East & North Africa (IDA & IBRD countries)Middle incomeMoldovaMongoliaMontenegroMoroccoMozambiqueMyanmarNamibiaNepalNetherlandsNew CaledoniaNew ZealandNicaraguaNigerNigeriaNorth AmericaNorwayOECD membersOmanOther small statesPacific island small statesPakistanPalauPanamaPapua New GuineaParaguayPeruPhilippinesPolandPortugalPost-demographic dividendPre-demographic dividendPuerto RicoQatarRomaniaRussian FederationRwandaSamoaSan MarinoSao Tome and PrincipeSaudi ArabiaSenegalSerbiaSeychellesSierra LeoneSingaporeSint Maarten (Dutch part)Slovak RepublicSloveniaSmall statesSolomon IslandsSomaliaSouth AfricaSouth AsiaSouth Asia (IDA & IBRD)South SudanSpainSri LankaSt. Kitts and NevisSt. LuciaSt. Martin (French part)St. Vincent and the GrenadinesSub-Saharan Africa Sub-Saharan Africa (excluding high income)Sub-Saharan Africa (IDA & IBRD countries)SudanSurinameSwazilandSwedenSwitzerlandSyrian Arab RepublicTajikistanTanzaniaThailandTimor-LesteTogoTongaTrinidad and TobagoTunisiaTurkeyTurkmenistanUgandaUkraineUnited Arab EmiratesUnited KingdomUnited StatesUpper middle incomeUruguayUzbekistanVanuatuVenezuela, RBVietnamVirgin Islands (U.S.)West Bank and GazaWorldYemen, Rep.ZambiaZimbabwe Timeline:
This timeline shows a graph from 1961 to 2015 of Lesotho. No data until 1960. Number of actual observations by date: 55.
Source name:
World Development Indicators
Source organization:
(1) United Nations Population Division. World Population Prospects, (2) Census reports and other statistical publications from national statistical offices, (3) Eurostat: Demographic Statistics, (4) United Nations Statistical Division. Population and Vital Statistics Reprot (various years), (5) U.S. Census Bureau: International Database, and (6) Secretariat of the Pacific Community: Statistics and Demography Programme.
Categories, topics:
Health, Gender
Last updated:
apr 23, 2017
Indicators value changes by year
At the date of observation
Value
Absolute change
Change from previous value
jan 1, 1961
5.839
+5.839
0.0%
jan 1, 1962
5.829
-0.01
-0.17%
jan 1, 1963
5.82
-0.009
-0.15%
jan 1, 1964
5.812
-0.008
-0.14%
jan 1, 1965
5.806
-0.006
-0.1%
jan 1, 1966
5.802
-0.004
-0.07%
jan 1, 1967
5.801
-0.001
-0.02%
jan 1, 1968
5.803
+0.002
0.03%
jan 1, 1969
5.805
+0.002
0.03%
jan 1, 1970
5.807
+0.002
0.03%
jan 1, 1971
5.808
+0.001
0.02%
jan 1, 1972
5.807
-0.001
-0.02%
jan 1, 1973
5.802
-0.005
-0.09%
jan 1, 1974
5.794
-0.008
-0.14%
jan 1, 1975
5.78
-0.014
-0.24%
jan 1, 1976
5.761
-0.019
-0.33%
jan 1, 1977
5.736
-0.025
-0.43%
jan 1, 1978
5.706
-0.03
-0.52%
jan 1, 1979
5.672
-0.034
-0.6%
jan 1, 1980
5.633
-0.039
-0.69%
jan 1, 1981
5.589
-0.044
-0.78%
jan 1, 1982
5.542
-0.047
-0.84%
jan 1, 1983
5.491
-0.051
-0.92%
jan 1, 1984
5.436
-0.055
-1.0%
jan 1, 1985
5.377
-0.059
-1.09%
jan 1, 1986
5.313
-0.064
-1.19%
jan 1, 1987
5.244
-0.069
-1.3%
jan 1, 1988
5.169
-0.075
-1.43%
jan 1, 1989
5.088
-0.081
-1.57%
jan 1, 1990
5.004
-0.084
-1.65%
jan 1, 1991
4.919
-0.085
-1.7%
jan 1, 1992
4.837
-0.082
-1.67%
jan 1, 1993
4.759
-0.078
-1.61%
jan 1, 1994
4.686
-0.073
-1.53%
jan 1, 1995
4.617
-0.069
-1.47%
jan 1, 1996
4.548
-0.069
-1.49%
jan 1, 1997
4.475
-0.073
-1.61%
jan 1, 1998
4.394
-0.081
-1.81%
jan 1, 1999
4.302
-0.092
-2.09%
jan 1, 2000
4.2
-0.102
-2.37%
jan 1, 2001
4.089
-0.111
-2.64%
jan 1, 2002
3.972
-0.117
-2.86%
jan 1, 2003
3.856
-0.116
-2.92%
jan 1, 2004
3.744
-0.112
-2.9%
jan 1, 2005
3.64
-0.104
-2.78%
jan 1, 2006
3.548
-0.092
-2.53%
jan 1, 2007
3.473
-0.075
-2.11%
jan 1, 2008
3.412
-0.061
-1.76%
jan 1, 2009
3.366
-0.046
-1.35%
jan 1, 2010
3.33
-0.036
-1.07%
jan 1, 2011
3.303
-0.027
-0.81%
jan 1, 2012
3.278
-0.025
-0.76%
jan 1, 2013
3.253
-0.025
-0.76%
jan 1, 2014
3.222
-0.031
-0.95%
jan 1, 2015
3.185
-0.037
-1.15%
Ranking of countries by current statistics by years


Comments: