29
/
en
AIzaSyAYiBZKx7MnpbEhh9jyipgxe19OcubqV5w
April 1, 2024
199091
Mongolia
MNG
true
2
1
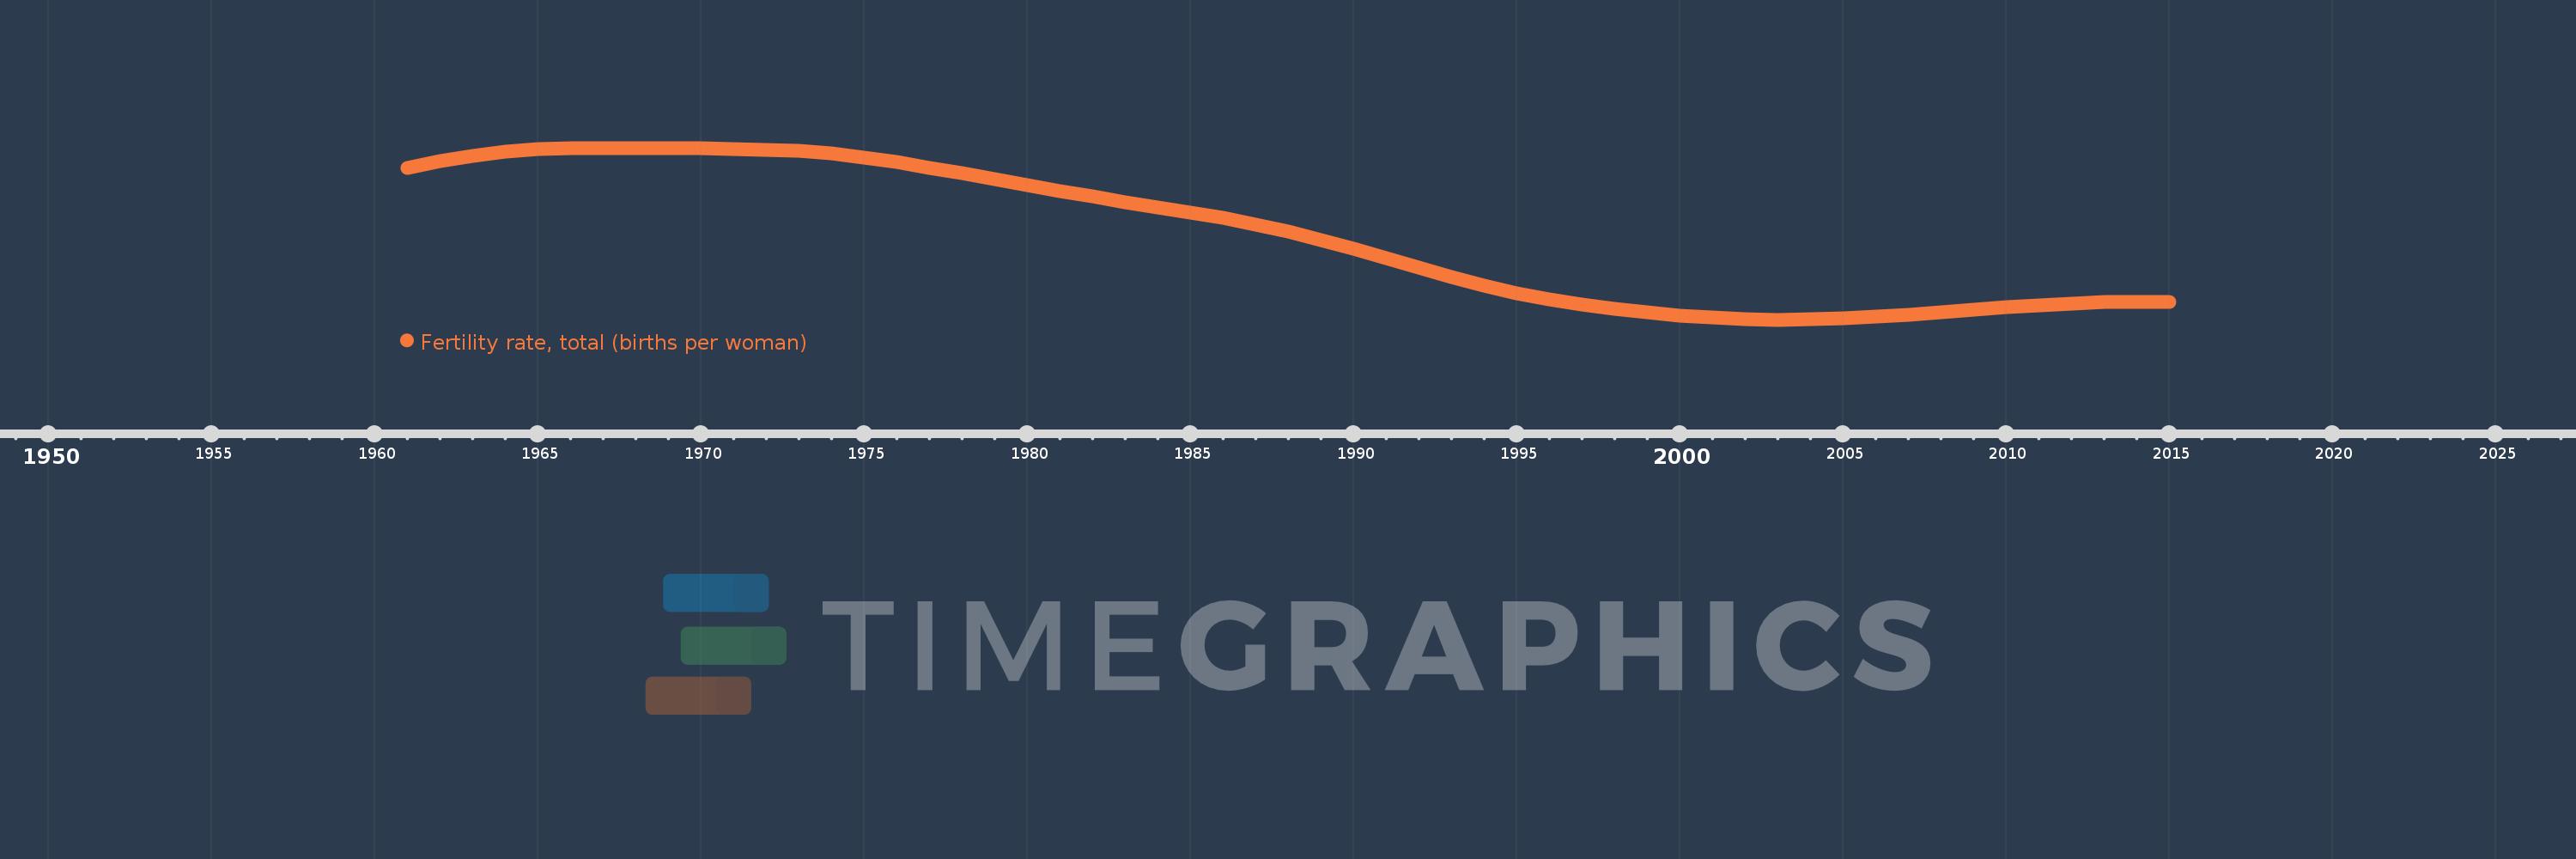
Fertility rate, total (births per woman)
2015,2014,2013,2012,2011,2010,2009,2008,2007,2006,2005,2004,2003,2002,2001,2000,1999,1998,1997,1996,1995,1994,1993,1992,1991,1990,1989,1988,1987,1986,1985,1984,1983,1982,1981,1980,1979,1978,1977,1976,1975,1974,1973,1972,1971,1970,1969,1968,1967,1966,1965,1964,1963,1962,1961
This statistics in other country:
AfghanistanAlbaniaAlgeriaAndorraAngolaAntigua and BarbudaArab WorldArgentinaArmeniaArubaAustraliaAustriaAzerbaijanBahamas, TheBahrainBangladeshBarbadosBelarusBelgiumBelizeBeninBermudaBhutanBoliviaBosnia and HerzegovinaBotswanaBrazilBrunei DarussalamBulgariaBurkina FasoBurundiCabo VerdeCambodiaCameroonCanadaCaribbean small statesCentral African RepublicCentral Europe and the BalticsChadChannel IslandsChileChinaColombiaComorosCongo, Dem. Rep.Congo, Rep.Costa RicaCote d'IvoireCroatiaCubaCuracaoCyprusCzech RepublicDenmarkDjiboutiDominicaDominican RepublicEarly-demographic dividendEast Asia & PacificEast Asia & Pacific (excluding high income)East Asia & Pacific (IDA & IBRD countries)EcuadorEgypt, Arab Rep.El SalvadorEquatorial GuineaEritreaEstoniaEthiopiaEuro areaEurope & Central AsiaEurope & Central Asia (excluding high income)Europe & Central Asia (IDA & IBRD countries)European UnionFaroe IslandsFijiFinlandFragile and conflict affected situationsFranceFrench PolynesiaGabonGambia, TheGeorgiaGermanyGhanaGreeceGreenlandGrenadaGuamGuatemalaGuineaGuinea-BissauGuyanaHaitiHeavily indebted poor countries (HIPC)High incomeHondurasHong Kong SAR, ChinaHungaryIBRD onlyIcelandIDA & IBRD totalIDA blendIDA onlyIDA totalIndiaIndonesiaIran, Islamic Rep.IraqIrelandIsle of ManIsraelItalyJamaicaJapanJordanKazakhstanKenyaKiribatiKorea, Dem. People’s Rep.Korea, Rep.KosovoKuwaitKyrgyz RepublicLao PDRLate-demographic dividendLatin America & Caribbean Latin America & Caribbean (excluding high income)Latin America & the Caribbean (IDA & IBRD countries)LatviaLeast developed countries: UN classificationLebanonLesothoLiberiaLibyaLiechtensteinLithuaniaLow & middle incomeLow incomeLower middle incomeLuxembourgMacao SAR, ChinaMacedonia, FYRMadagascarMalawiMalaysiaMaldivesMaliMaltaMarshall IslandsMauritaniaMauritiusMexicoMicronesia, Fed. Sts.Middle East & North AfricaMiddle East & North Africa (excluding high income)Middle East & North Africa (IDA & IBRD countries)Middle incomeMoldovaMongoliaMontenegroMoroccoMozambiqueMyanmarNamibiaNepalNetherlandsNew CaledoniaNew ZealandNicaraguaNigerNigeriaNorth AmericaNorwayOECD membersOmanOther small statesPacific island small statesPakistanPalauPanamaPapua New GuineaParaguayPeruPhilippinesPolandPortugalPost-demographic dividendPre-demographic dividendPuerto RicoQatarRomaniaRussian FederationRwandaSamoaSan MarinoSao Tome and PrincipeSaudi ArabiaSenegalSerbiaSeychellesSierra LeoneSingaporeSint Maarten (Dutch part)Slovak RepublicSloveniaSmall statesSolomon IslandsSomaliaSouth AfricaSouth AsiaSouth Asia (IDA & IBRD)South SudanSpainSri LankaSt. Kitts and NevisSt. LuciaSt. Martin (French part)St. Vincent and the GrenadinesSub-Saharan Africa Sub-Saharan Africa (excluding high income)Sub-Saharan Africa (IDA & IBRD countries)SudanSurinameSwazilandSwedenSwitzerlandSyrian Arab RepublicTajikistanTanzaniaThailandTimor-LesteTogoTongaTrinidad and TobagoTunisiaTurkeyTurkmenistanUgandaUkraineUnited Arab EmiratesUnited KingdomUnited StatesUpper middle incomeUruguayUzbekistanVanuatuVenezuela, RBVietnamVirgin Islands (U.S.)West Bank and GazaWorldYemen, Rep.ZambiaZimbabwe Timeline:
This timeline shows a graph from 1961 to 2015 of Mongolia. No data until 1960. Number of actual observations by date: 55.
Source name:
World Development Indicators
Source organization:
(1) United Nations Population Division. World Population Prospects, (2) Census reports and other statistical publications from national statistical offices, (3) Eurostat: Demographic Statistics, (4) United Nations Statistical Division. Population and Vital Statistics Reprot (various years), (5) U.S. Census Bureau: International Database, and (6) Secretariat of the Pacific Community: Statistics and Demography Programme.
Categories, topics:
Health, Gender
Last updated:
apr 23, 2017
Indicators value changes by year
At the date of observation
Value
Absolute change
Change from previous value
jan 1, 1961
6.953
+6.953
0.0%
jan 1, 1962
7.168
+0.215
3.09%
jan 1, 1963
7.347
+0.179
2.5%
jan 1, 1964
7.477
+0.13
1.77%
jan 1, 1965
7.558
+0.081
1.08%
jan 1, 1966
7.593
+0.035
0.46%
jan 1, 1967
7.599
+0.006
0.08%
jan 1, 1968
7.591
-0.008
-0.11%
jan 1, 1969
7.584
-0.007
-0.09%
jan 1, 1970
7.578
-0.006
-0.08%
jan 1, 1971
7.569
-0.009
-0.12%
jan 1, 1972
7.546
-0.023
-0.3%
jan 1, 1973
7.497
-0.049
-0.65%
jan 1, 1974
7.413
-0.084
-1.12%
jan 1, 1975
7.294
-0.119
-1.61%
jan 1, 1976
7.144
-0.15
-2.06%
jan 1, 1977
6.969
-0.175
-2.45%
jan 1, 1978
6.78
-0.189
-2.71%
jan 1, 1979
6.587
-0.193
-2.85%
jan 1, 1980
6.395
-0.192
-2.91%
jan 1, 1981
6.209
-0.186
-2.91%
jan 1, 1982
6.033
-0.176
-2.83%
jan 1, 1983
5.864
-0.169
-2.8%
jan 1, 1984
5.696
-0.168
-2.86%
jan 1, 1985
5.526
-0.17
-2.98%
jan 1, 1986
5.345
-0.181
-3.28%
jan 1, 1987
5.14
-0.205
-3.84%
jan 1, 1988
4.906
-0.234
-4.55%
jan 1, 1989
4.644
-0.262
-5.34%
jan 1, 1990
4.356
-0.288
-6.2%
jan 1, 1991
4.052
-0.304
-6.98%
jan 1, 1992
3.746
-0.306
-7.55%
jan 1, 1993
3.451
-0.295
-7.88%
jan 1, 1994
3.18
-0.271
-7.85%
jan 1, 1995
2.941
-0.239
-7.52%
jan 1, 1996
2.738
-0.203
-6.9%
jan 1, 1997
2.57
-0.168
-6.14%
jan 1, 1998
2.43
-0.14
-5.45%
jan 1, 1999
2.312
-0.118
-4.86%
jan 1, 2000
2.216
-0.096
-4.15%
jan 1, 2001
2.143
-0.073
-3.29%
jan 1, 2002
2.098
-0.045
-2.1%
jan 1, 2003
2.081
-0.017
-0.81%
jan 1, 2004
2.091
+0.01
0.48%
jan 1, 2005
2.124
+0.033
1.58%
jan 1, 2006
2.176
+0.052
2.45%
jan 1, 2007
2.245
+0.069
3.17%
jan 1, 2008
2.324
+0.079
3.52%
jan 1, 2009
2.407
+0.083
3.57%
jan 1, 2010
2.487
+0.08
3.32%
jan 1, 2011
2.555
+0.068
2.73%
jan 1, 2012
2.607
+0.052
2.04%
jan 1, 2013
2.641
+0.034
1.3%
jan 1, 2014
2.657
+0.016
0.61%
jan 1, 2015
2.655
-0.002
-0.08%
Ranking of countries by current statistics by years


Comments: