29
/
en
AIzaSyAYiBZKx7MnpbEhh9jyipgxe19OcubqV5w
April 1, 2024
280924
Venezuela, RB
VEN
true
2
1
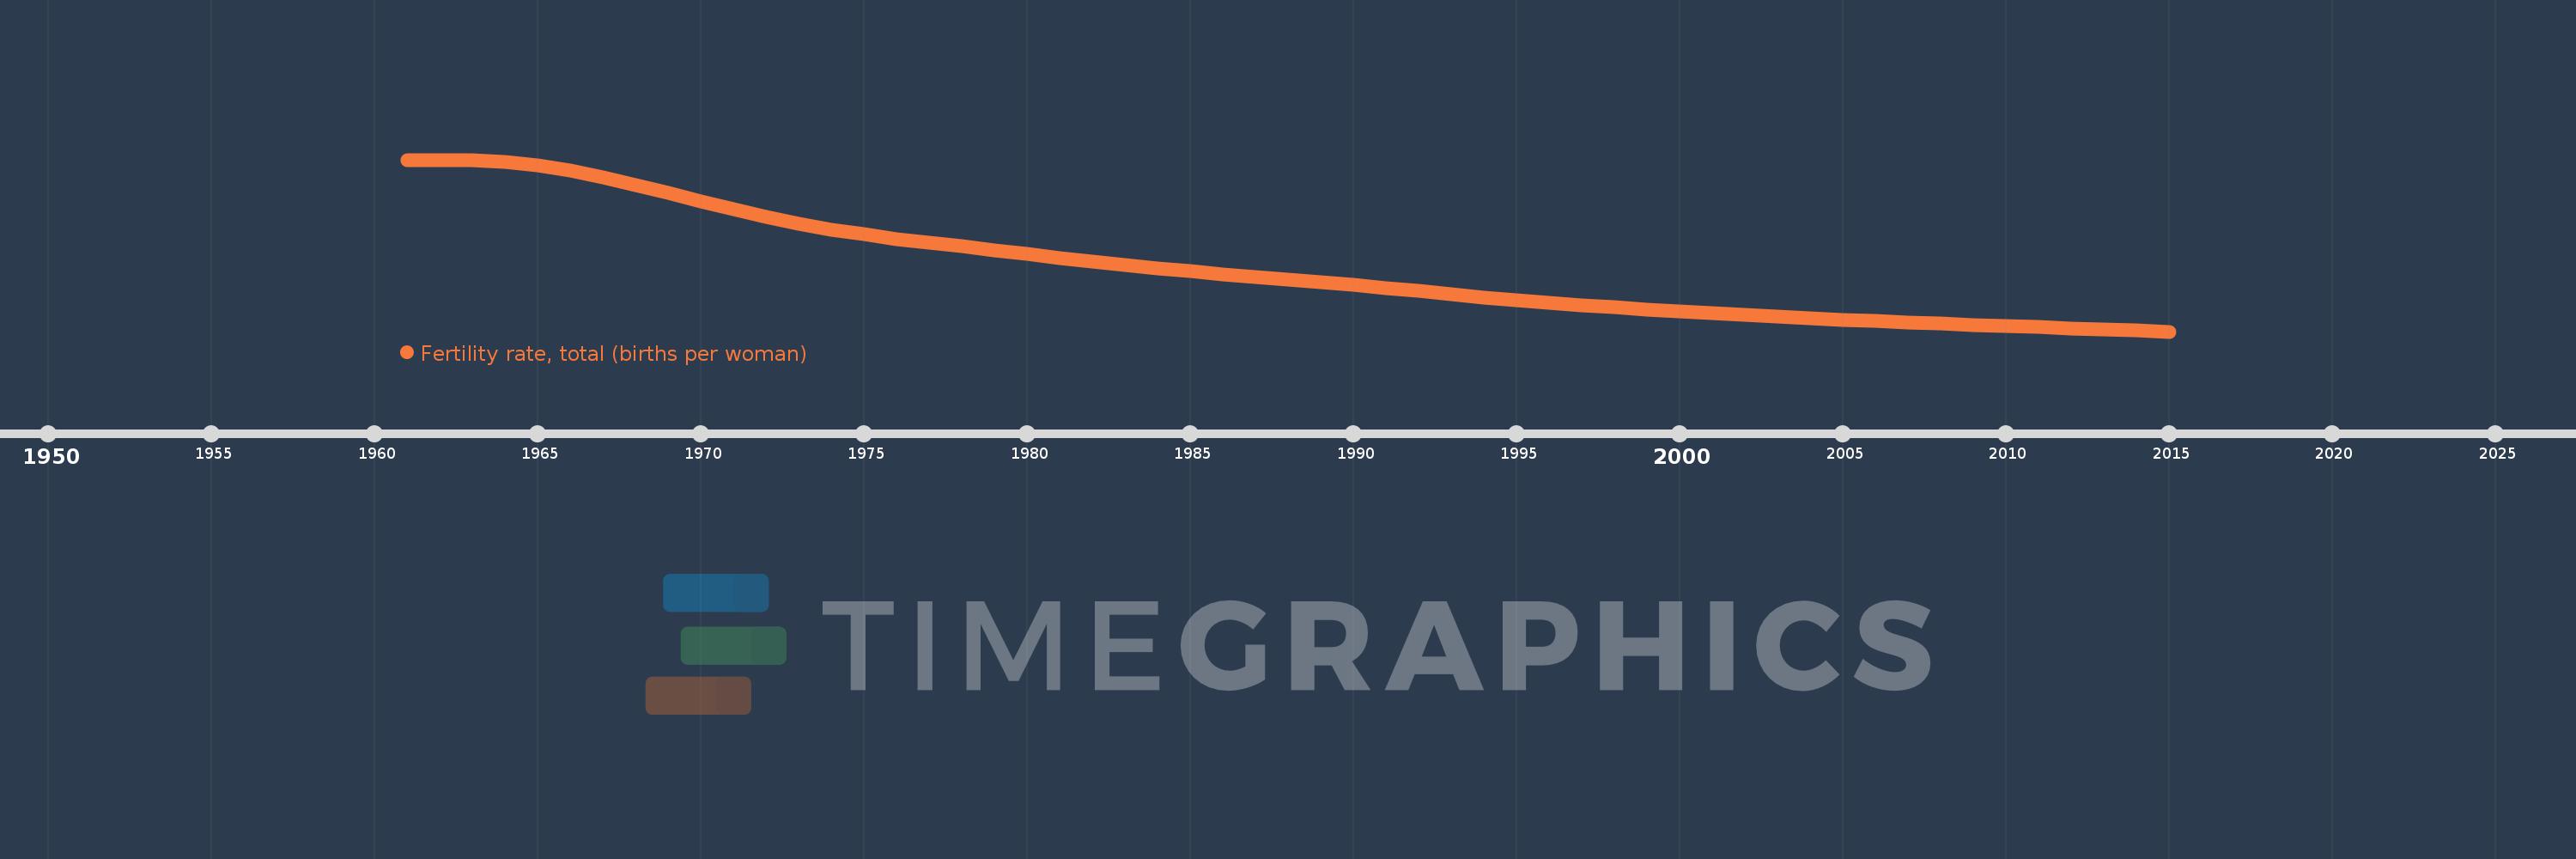
Fertility rate, total (births per woman)
2015,2014,2013,2012,2011,2010,2009,2008,2007,2006,2005,2004,2003,2002,2001,2000,1999,1998,1997,1996,1995,1994,1993,1992,1991,1990,1989,1988,1987,1986,1985,1984,1983,1982,1981,1980,1979,1978,1977,1976,1975,1974,1973,1972,1971,1970,1969,1968,1967,1966,1965,1964,1963,1962,1961
This statistics in other country:
AfghanistanAlbaniaAlgeriaAndorraAngolaAntigua and BarbudaArab WorldArgentinaArmeniaArubaAustraliaAustriaAzerbaijanBahamas, TheBahrainBangladeshBarbadosBelarusBelgiumBelizeBeninBermudaBhutanBoliviaBosnia and HerzegovinaBotswanaBrazilBrunei DarussalamBulgariaBurkina FasoBurundiCabo VerdeCambodiaCameroonCanadaCaribbean small statesCentral African RepublicCentral Europe and the BalticsChadChannel IslandsChileChinaColombiaComorosCongo, Dem. Rep.Congo, Rep.Costa RicaCote d'IvoireCroatiaCubaCuracaoCyprusCzech RepublicDenmarkDjiboutiDominicaDominican RepublicEarly-demographic dividendEast Asia & PacificEast Asia & Pacific (excluding high income)East Asia & Pacific (IDA & IBRD countries)EcuadorEgypt, Arab Rep.El SalvadorEquatorial GuineaEritreaEstoniaEthiopiaEuro areaEurope & Central AsiaEurope & Central Asia (excluding high income)Europe & Central Asia (IDA & IBRD countries)European UnionFaroe IslandsFijiFinlandFragile and conflict affected situationsFranceFrench PolynesiaGabonGambia, TheGeorgiaGermanyGhanaGreeceGreenlandGrenadaGuamGuatemalaGuineaGuinea-BissauGuyanaHaitiHeavily indebted poor countries (HIPC)High incomeHondurasHong Kong SAR, ChinaHungaryIBRD onlyIcelandIDA & IBRD totalIDA blendIDA onlyIDA totalIndiaIndonesiaIran, Islamic Rep.IraqIrelandIsle of ManIsraelItalyJamaicaJapanJordanKazakhstanKenyaKiribatiKorea, Dem. People’s Rep.Korea, Rep.KosovoKuwaitKyrgyz RepublicLao PDRLate-demographic dividendLatin America & Caribbean Latin America & Caribbean (excluding high income)Latin America & the Caribbean (IDA & IBRD countries)LatviaLeast developed countries: UN classificationLebanonLesothoLiberiaLibyaLiechtensteinLithuaniaLow & middle incomeLow incomeLower middle incomeLuxembourgMacao SAR, ChinaMacedonia, FYRMadagascarMalawiMalaysiaMaldivesMaliMaltaMarshall IslandsMauritaniaMauritiusMexicoMicronesia, Fed. Sts.Middle East & North AfricaMiddle East & North Africa (excluding high income)Middle East & North Africa (IDA & IBRD countries)Middle incomeMoldovaMongoliaMontenegroMoroccoMozambiqueMyanmarNamibiaNepalNetherlandsNew CaledoniaNew ZealandNicaraguaNigerNigeriaNorth AmericaNorwayOECD membersOmanOther small statesPacific island small statesPakistanPalauPanamaPapua New GuineaParaguayPeruPhilippinesPolandPortugalPost-demographic dividendPre-demographic dividendPuerto RicoQatarRomaniaRussian FederationRwandaSamoaSan MarinoSao Tome and PrincipeSaudi ArabiaSenegalSerbiaSeychellesSierra LeoneSingaporeSint Maarten (Dutch part)Slovak RepublicSloveniaSmall statesSolomon IslandsSomaliaSouth AfricaSouth AsiaSouth Asia (IDA & IBRD)South SudanSpainSri LankaSt. Kitts and NevisSt. LuciaSt. Martin (French part)St. Vincent and the GrenadinesSub-Saharan Africa Sub-Saharan Africa (excluding high income)Sub-Saharan Africa (IDA & IBRD countries)SudanSurinameSwazilandSwedenSwitzerlandSyrian Arab RepublicTajikistanTanzaniaThailandTimor-LesteTogoTongaTrinidad and TobagoTunisiaTurkeyTurkmenistanUgandaUkraineUnited Arab EmiratesUnited KingdomUnited StatesUpper middle incomeUruguayUzbekistanVanuatuVenezuela, RBVietnamVirgin Islands (U.S.)West Bank and GazaWorldYemen, Rep.ZambiaZimbabwe Timeline:
This timeline shows a graph from 1961 to 2015 of Venezuela, RB. No data until 1960. Number of actual observations by date: 55.
Source name:
World Development Indicators
Source organization:
(1) United Nations Population Division. World Population Prospects, (2) Census reports and other statistical publications from national statistical offices, (3) Eurostat: Demographic Statistics, (4) United Nations Statistical Division. Population and Vital Statistics Reprot (various years), (5) U.S. Census Bureau: International Database, and (6) Secretariat of the Pacific Community: Statistics and Demography Programme.
Categories, topics:
Health, Gender
Last updated:
apr 23, 2017
Indicators value changes by year
At the date of observation
Value
Absolute change
Change from previous value
jan 1, 1961
6.616
+6.616
0.0%
jan 1, 1962
6.637
+0.021
0.32%
jan 1, 1963
6.628
-0.009
-0.14%
jan 1, 1964
6.581
-0.047
-0.71%
jan 1, 1965
6.495
-0.086
-1.31%
jan 1, 1966
6.368
-0.127
-1.96%
jan 1, 1967
6.203
-0.165
-2.59%
jan 1, 1968
6.014
-0.189
-3.05%
jan 1, 1969
5.811
-0.203
-3.38%
jan 1, 1970
5.605
-0.206
-3.55%
jan 1, 1971
5.404
-0.201
-3.59%
jan 1, 1972
5.219
-0.185
-3.42%
jan 1, 1973
5.053
-0.166
-3.18%
jan 1, 1974
4.905
-0.148
-2.93%
jan 1, 1975
4.779
-0.126
-2.57%
jan 1, 1976
4.67
-0.109
-2.28%
jan 1, 1977
4.574
-0.096
-2.06%
jan 1, 1978
4.483
-0.091
-1.99%
jan 1, 1979
4.391
-0.092
-2.05%
jan 1, 1980
4.296
-0.095
-2.16%
jan 1, 1981
4.199
-0.097
-2.26%
jan 1, 1982
4.104
-0.095
-2.26%
jan 1, 1983
4.014
-0.09
-2.19%
jan 1, 1984
3.933
-0.081
-2.02%
jan 1, 1985
3.861
-0.072
-1.83%
jan 1, 1986
3.794
-0.067
-1.74%
jan 1, 1987
3.73
-0.064
-1.69%
jan 1, 1988
3.665
-0.065
-1.74%
jan 1, 1989
3.597
-0.068
-1.86%
jan 1, 1990
3.524
-0.073
-2.03%
jan 1, 1991
3.448
-0.076
-2.16%
jan 1, 1992
3.37
-0.078
-2.26%
jan 1, 1993
3.292
-0.078
-2.31%
jan 1, 1994
3.218
-0.074
-2.25%
jan 1, 1995
3.147
-0.071
-2.21%
jan 1, 1996
3.082
-0.065
-2.07%
jan 1, 1997
3.022
-0.06
-1.95%
jan 1, 1998
2.967
-0.055
-1.82%
jan 1, 1999
2.915
-0.052
-1.75%
jan 1, 2000
2.867
-0.048
-1.65%
jan 1, 2001
2.822
-0.045
-1.57%
jan 1, 2002
2.779
-0.043
-1.52%
jan 1, 2003
2.739
-0.04
-1.44%
jan 1, 2004
2.701
-0.038
-1.39%
jan 1, 2005
2.664
-0.037
-1.37%
jan 1, 2006
2.629
-0.035
-1.31%
jan 1, 2007
2.595
-0.034
-1.29%
jan 1, 2008
2.562
-0.033
-1.27%
jan 1, 2009
2.531
-0.031
-1.21%
jan 1, 2010
2.501
-0.03
-1.19%
jan 1, 2011
2.472
-0.029
-1.16%
jan 1, 2012
2.444
-0.028
-1.13%
jan 1, 2013
2.417
-0.027
-1.1%
jan 1, 2014
2.391
-0.026
-1.08%
jan 1, 2015
2.365
-0.026
-1.09%
Ranking of countries by current statistics by years


Comments: