29
/
en
AIzaSyAYiBZKx7MnpbEhh9jyipgxe19OcubqV5w
April 1, 2024
226723
Puerto Rico
PRI
true
2
1
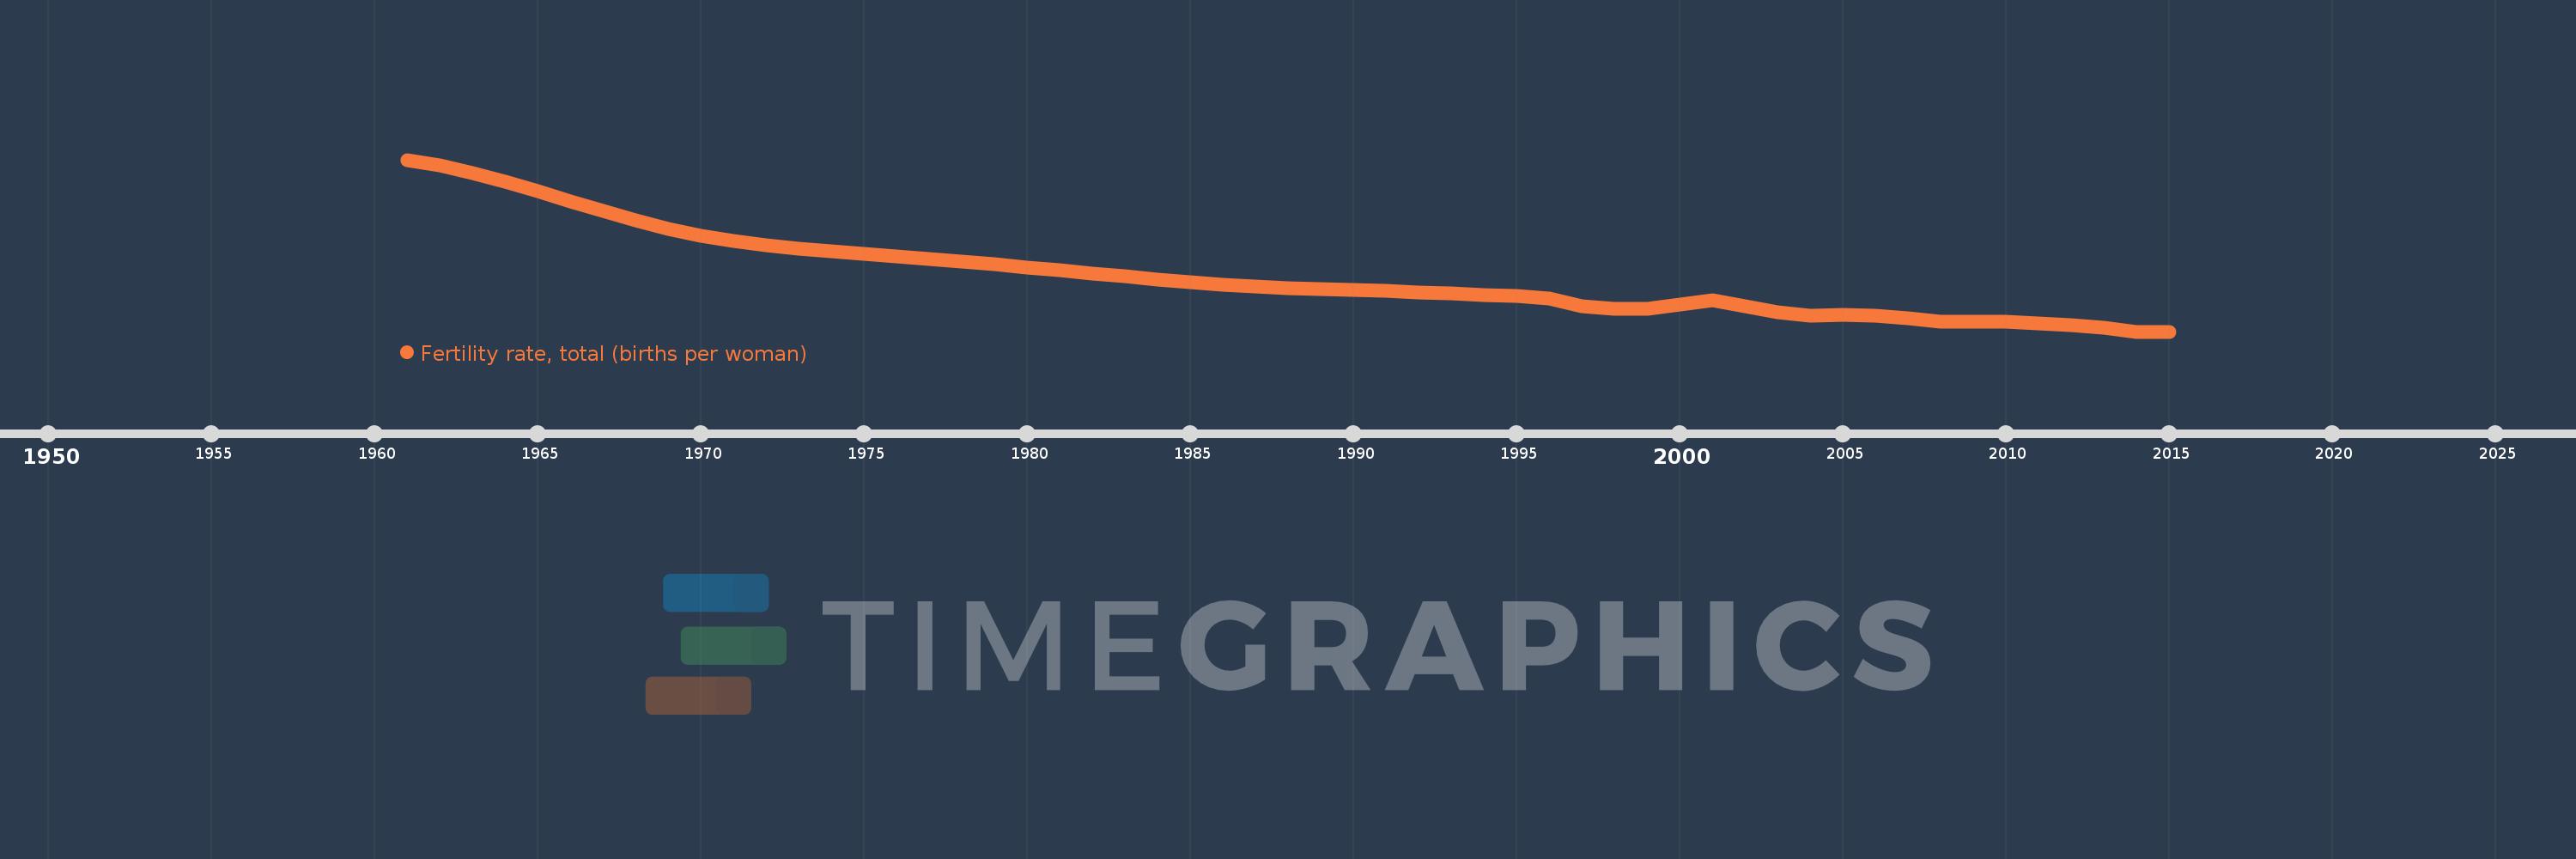
Fertility rate, total (births per woman)
2015,2014,2013,2012,2011,2010,2009,2008,2007,2006,2005,2004,2003,2002,2001,2000,1999,1998,1997,1996,1995,1994,1993,1992,1991,1990,1989,1988,1987,1986,1985,1984,1983,1982,1981,1980,1979,1978,1977,1976,1975,1974,1973,1972,1971,1970,1969,1968,1967,1966,1965,1964,1963,1962,1961
This statistics in other country:
AfghanistanAlbaniaAlgeriaAndorraAngolaAntigua and BarbudaArab WorldArgentinaArmeniaArubaAustraliaAustriaAzerbaijanBahamas, TheBahrainBangladeshBarbadosBelarusBelgiumBelizeBeninBermudaBhutanBoliviaBosnia and HerzegovinaBotswanaBrazilBrunei DarussalamBulgariaBurkina FasoBurundiCabo VerdeCambodiaCameroonCanadaCaribbean small statesCentral African RepublicCentral Europe and the BalticsChadChannel IslandsChileChinaColombiaComorosCongo, Dem. Rep.Congo, Rep.Costa RicaCote d'IvoireCroatiaCubaCuracaoCyprusCzech RepublicDenmarkDjiboutiDominicaDominican RepublicEarly-demographic dividendEast Asia & PacificEast Asia & Pacific (excluding high income)East Asia & Pacific (IDA & IBRD countries)EcuadorEgypt, Arab Rep.El SalvadorEquatorial GuineaEritreaEstoniaEthiopiaEuro areaEurope & Central AsiaEurope & Central Asia (excluding high income)Europe & Central Asia (IDA & IBRD countries)European UnionFaroe IslandsFijiFinlandFragile and conflict affected situationsFranceFrench PolynesiaGabonGambia, TheGeorgiaGermanyGhanaGreeceGreenlandGrenadaGuamGuatemalaGuineaGuinea-BissauGuyanaHaitiHeavily indebted poor countries (HIPC)High incomeHondurasHong Kong SAR, ChinaHungaryIBRD onlyIcelandIDA & IBRD totalIDA blendIDA onlyIDA totalIndiaIndonesiaIran, Islamic Rep.IraqIrelandIsle of ManIsraelItalyJamaicaJapanJordanKazakhstanKenyaKiribatiKorea, Dem. People’s Rep.Korea, Rep.KosovoKuwaitKyrgyz RepublicLao PDRLate-demographic dividendLatin America & Caribbean Latin America & Caribbean (excluding high income)Latin America & the Caribbean (IDA & IBRD countries)LatviaLeast developed countries: UN classificationLebanonLesothoLiberiaLibyaLiechtensteinLithuaniaLow & middle incomeLow incomeLower middle incomeLuxembourgMacao SAR, ChinaMacedonia, FYRMadagascarMalawiMalaysiaMaldivesMaliMaltaMarshall IslandsMauritaniaMauritiusMexicoMicronesia, Fed. Sts.Middle East & North AfricaMiddle East & North Africa (excluding high income)Middle East & North Africa (IDA & IBRD countries)Middle incomeMoldovaMongoliaMontenegroMoroccoMozambiqueMyanmarNamibiaNepalNetherlandsNew CaledoniaNew ZealandNicaraguaNigerNigeriaNorth AmericaNorwayOECD membersOmanOther small statesPacific island small statesPakistanPalauPanamaPapua New GuineaParaguayPeruPhilippinesPolandPortugalPost-demographic dividendPre-demographic dividendPuerto RicoQatarRomaniaRussian FederationRwandaSamoaSan MarinoSao Tome and PrincipeSaudi ArabiaSenegalSerbiaSeychellesSierra LeoneSingaporeSint Maarten (Dutch part)Slovak RepublicSloveniaSmall statesSolomon IslandsSomaliaSouth AfricaSouth AsiaSouth Asia (IDA & IBRD)South SudanSpainSri LankaSt. Kitts and NevisSt. LuciaSt. Martin (French part)St. Vincent and the GrenadinesSub-Saharan Africa Sub-Saharan Africa (excluding high income)Sub-Saharan Africa (IDA & IBRD countries)SudanSurinameSwazilandSwedenSwitzerlandSyrian Arab RepublicTajikistanTanzaniaThailandTimor-LesteTogoTongaTrinidad and TobagoTunisiaTurkeyTurkmenistanUgandaUkraineUnited Arab EmiratesUnited KingdomUnited StatesUpper middle incomeUruguayUzbekistanVanuatuVenezuela, RBVietnamVirgin Islands (U.S.)West Bank and GazaWorldYemen, Rep.ZambiaZimbabwe Timeline:
This timeline shows a graph from 1961 to 2015 of Puerto Rico. No data until 1960. Number of actual observations by date: 55.
Source name:
World Development Indicators
Source organization:
(1) United Nations Population Division. World Population Prospects, (2) Census reports and other statistical publications from national statistical offices, (3) Eurostat: Demographic Statistics, (4) United Nations Statistical Division. Population and Vital Statistics Reprot (various years), (5) U.S. Census Bureau: International Database, and (6) Secretariat of the Pacific Community: Statistics and Demography Programme.
Categories, topics:
Health, Gender
Last updated:
apr 23, 2017
Indicators value changes by year
At the date of observation
Value
Absolute change
Change from previous value
jan 1, 1961
4.657
+4.657
0.0%
jan 1, 1962
4.547
-0.11
-2.36%
jan 1, 1963
4.411
-0.136
-2.99%
jan 1, 1964
4.252
-0.159
-3.6%
jan 1, 1965
4.075
-0.177
-4.16%
jan 1, 1966
3.888
-0.187
-4.59%
jan 1, 1967
3.703
-0.185
-4.76%
jan 1, 1968
3.53
-0.173
-4.67%
jan 1, 1969
3.377
-0.153
-4.33%
jan 1, 1970
3.248
-0.129
-3.82%
jan 1, 1971
3.146
-0.102
-3.14%
jan 1, 1972
3.068
-0.078
-2.48%
jan 1, 1973
3.006
-0.062
-2.02%
jan 1, 1974
2.955
-0.051
-1.7%
jan 1, 1975
2.908
-0.047
-1.59%
jan 1, 1976
2.864
-0.044
-1.51%
jan 1, 1977
2.818
-0.046
-1.61%
jan 1, 1978
2.769
-0.049
-1.74%
jan 1, 1979
2.718
-0.051
-1.84%
jan 1, 1980
2.664
-0.054
-1.99%
jan 1, 1981
2.607
-0.057
-2.14%
jan 1, 1982
2.548
-0.059
-2.26%
jan 1, 1983
2.49
-0.058
-2.28%
jan 1, 1984
2.436
-0.054
-2.17%
jan 1, 1985
2.387
-0.049
-2.01%
jan 1, 1986
2.344
-0.043
-1.8%
jan 1, 1987
2.308
-0.036
-1.54%
jan 1, 1988
2.279
-0.029
-1.26%
jan 1, 1989
2.256
-0.023
-1.01%
jan 1, 1990
2.236
-0.02
-0.89%
jan 1, 1991
2.219
-0.017
-0.76%
jan 1, 1992
2.201
-0.018
-0.81%
jan 1, 1993
2.18
-0.021
-0.95%
jan 1, 1994
2.154
-0.026
-1.19%
jan 1, 1995
2.124
-0.03
-1.39%
jan 1, 1996
2.088
-0.036
-1.69%
jan 1, 1997
1.94
-0.148
-7.09%
jan 1, 1998
1.9
-0.04
-2.06%
jan 1, 2000
1.974
+0.074
3.91%
jan 1, 2001
2.049
+0.074
3.76%
jan 1, 2002
1.935
-0.114
-5.56%
jan 1, 2003
1.832
-0.103
-5.32%
jan 1, 2004
1.762
-0.069
-3.78%
jan 1, 2005
1.782
+0.02
1.12%
jan 1, 2006
1.77
-0.012
-0.67%
jan 1, 2007
1.712
-0.058
-3.27%
jan 1, 2008
1.651
-0.062
-3.61%
jan 1, 2009
1.652
+0.001
0.07%
jan 1, 2010
1.653
+0.001
0.07%
jan 1, 2011
1.623
-0.029
-1.77%
jan 1, 2012
1.597
-0.027
-1.66%
jan 1, 2013
1.542
-0.054
-3.38%
jan 1, 2014
1.47
-0.073
-4.7%
Ranking of countries by current statistics by years


Comments: