29
/
en
AIzaSyAYiBZKx7MnpbEhh9jyipgxe19OcubqV5w
April 1, 2024
78114
Bangladesh
BGD
true
2
1
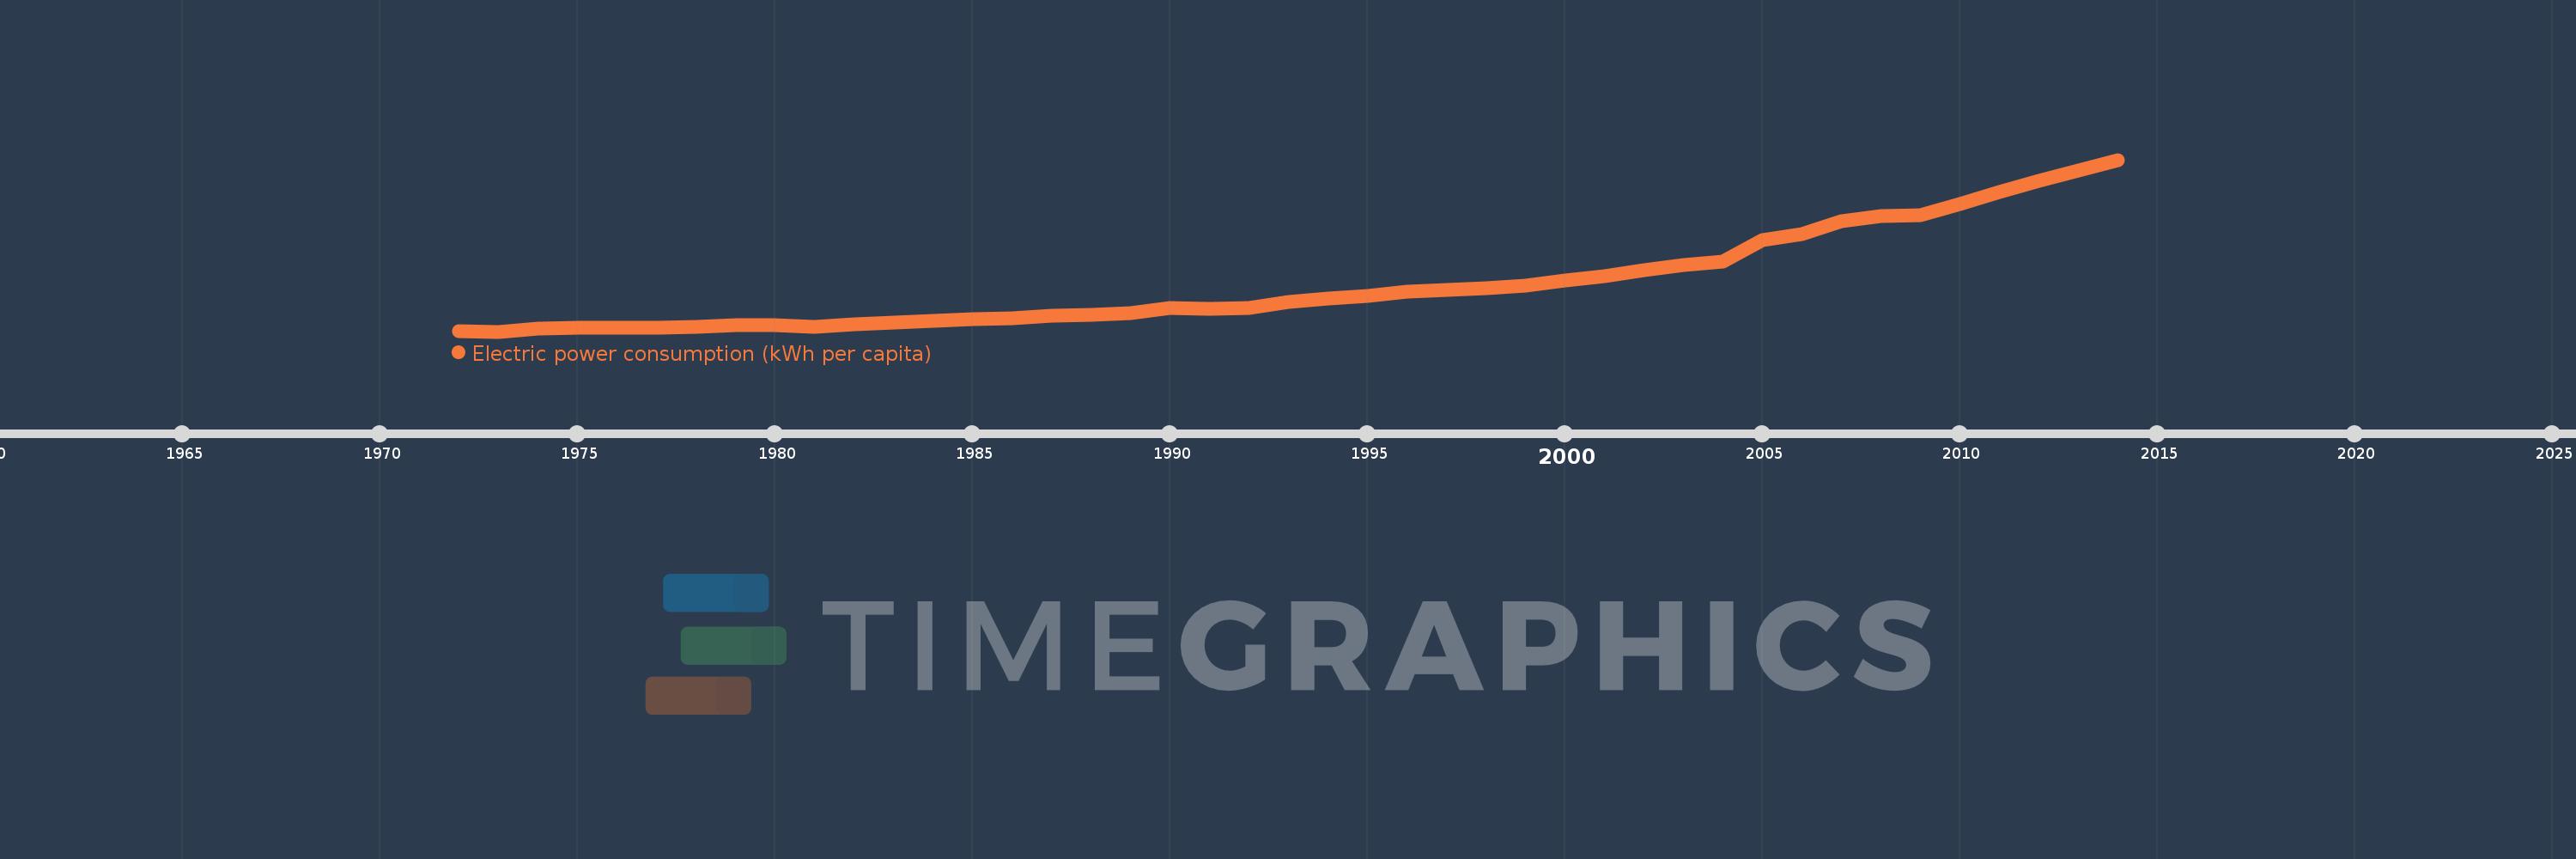
Electric power consumption (kWh per capita)
2014,2013,2012,2011,2010,2009,2008,2007,2006,2005,2004,2003,2002,2001,2000,1999,1998,1997,1996,1995,1994,1993,1992,1991,1990,1989,1988,1987,1986,1985,1984,1983,1982,1981,1980,1979,1978,1977,1976,1975,1974,1973,1972
This statistics in other country:
AlbaniaAlgeriaAngolaArab WorldArgentinaArmeniaAustraliaAustriaAzerbaijanBahrainBangladeshBelarusBelgiumBeninBoliviaBosnia and HerzegovinaBotswanaBrazilBrunei DarussalamBulgariaCambodiaCameroonCanadaCentral Europe and the BalticsChileChinaColombiaCongo, Dem. Rep.Congo, Rep.Costa RicaCote d'IvoireCroatiaCubaCuracaoCyprusCzech RepublicDenmarkDominican RepublicEarly-demographic dividendEast Asia & PacificEast Asia & Pacific (excluding high income)East Asia & Pacific (IDA & IBRD countries)EcuadorEgypt, Arab Rep.El SalvadorEritreaEstoniaEthiopiaEuro areaEurope & Central AsiaEurope & Central Asia (excluding high income)Europe & Central Asia (IDA & IBRD countries)European UnionFinlandFragile and conflict affected situationsFranceGabonGeorgiaGermanyGhanaGibraltarGreeceGuatemalaHaitiHeavily indebted poor countries (HIPC)High incomeHondurasHong Kong SAR, ChinaHungaryIBRD onlyIcelandIDA & IBRD totalIDA blendIDA onlyIDA totalIndiaIndonesiaIran, Islamic Rep.IraqIrelandIsraelItalyJamaicaJapanJordanKazakhstanKenyaKorea, Dem. People’s Rep.Korea, Rep.KosovoKuwaitKyrgyz RepublicLate-demographic dividendLatin America & Caribbean Latin America & Caribbean (excluding high income)Latin America & the Caribbean (IDA & IBRD countries)LatviaLeast developed countries: UN classificationLebanonLibyaLithuaniaLow & middle incomeLower middle incomeLuxembourgMacedonia, FYRMalaysiaMaltaMauritiusMexicoMiddle East & North AfricaMiddle East & North Africa (excluding high income)Middle East & North Africa (IDA & IBRD countries)Middle incomeMoldovaMongoliaMontenegroMoroccoMozambiqueMyanmarNamibiaNepalNetherlandsNew ZealandNicaraguaNigerNigeriaNorth AmericaNorwayOECD membersOmanPakistanPanamaParaguayPeruPhilippinesPolandPortugalPost-demographic dividendPre-demographic dividendQatarRomaniaRussian FederationSaudi ArabiaSenegalSerbiaSingaporeSlovak RepublicSloveniaSouth AfricaSouth AsiaSouth Asia (IDA & IBRD)South SudanSpainSri LankaSub-Saharan Africa Sub-Saharan Africa (excluding high income)Sub-Saharan Africa (IDA & IBRD countries)SudanSwedenSwitzerlandSyrian Arab RepublicTajikistanTanzaniaThailandTogoTrinidad and TobagoTunisiaTurkeyTurkmenistanUkraineUnited Arab EmiratesUnited KingdomUnited StatesUpper middle incomeUruguayUzbekistanVenezuela, RBVietnamWorldYemen, Rep.ZambiaZimbabwe Timeline:
This timeline shows a graph from 1972 to 2014 of Bangladesh. No data until 1971. Number of actual observations by date: 43.
Source name:
World Development Indicators
Source organization:
IEA Statistics © OECD/IEA 2014 (http://www.iea.org/stats/index.asp), subject to https://www.iea.org/t&c/termsandconditions/
Categories, topics:
Energy & Mining, Climate Change, Infrastructure
Last updated:
apr 23, 2017
Indicators value changes by year
Minimum:
10.506
jan 1, 1973
Maximum:
293.025
jan 1, 2014
At the date of observation
Value
Absolute change
Change from previous value
jan 1, 1972
10.69
+10.69
0.0%
jan 1, 1973
10.506
-0.184
-1.72%
jan 1, 1974
15.177
+4.67
44.45%
jan 1, 1975
16.868
+1.691
11.14%
jan 1, 1976
16.997
+0.13
0.77%
jan 1, 1977
17.291
+0.293
1.73%
jan 1, 1978
18.264
+0.973
5.63%
jan 1, 1979
21.456
+3.192
17.48%
jan 1, 1980
20.988
-0.468
-2.18%
jan 1, 1981
18.706
-2.282
-10.87%
jan 1, 1982
22.333
+3.627
19.39%
jan 1, 1983
25.248
+2.915
13.05%
jan 1, 1984
28.77
+3.522
13.95%
jan 1, 1985
31.659
+2.888
10.04%
jan 1, 1986
32.694
+1.035
3.27%
jan 1, 1987
36.996
+4.302
13.16%
jan 1, 1988
38.401
+1.405
3.8%
jan 1, 1989
41.417
+3.016
7.86%
jan 1, 1990
49.265
+7.848
18.95%
jan 1, 1991
48.461
-0.804
-1.63%
jan 1, 1992
49.065
+0.604
1.25%
jan 1, 1993
58.772
+9.708
19.79%
jan 1, 1994
65.355
+6.582
11.2%
jan 1, 1995
69.129
+3.774
5.77%
jan 1, 1996
76.08
+6.951
10.06%
jan 1, 1997
79.678
+3.598
4.73%
jan 1, 1998
81.433
+1.755
2.2%
jan 1, 1999
86.36
+4.927
6.05%
jan 1, 2000
94.48
+8.12
9.4%
jan 1, 2001
101.721
+7.241
7.66%
jan 1, 2002
111.971
+10.25
10.08%
jan 1, 2003
119.601
+7.63
6.81%
jan 1, 2004
125.837
+6.236
5.21%
jan 1, 2005
160.781
+34.944
27.77%
jan 1, 2006
171.28
+10.499
6.53%
jan 1, 2007
191.612
+20.333
11.87%
jan 1, 2008
200.576
+8.964
4.68%
jan 1, 2009
202.0
+1.424
0.71%
jan 1, 2010
220.045
+18.045
8.93%
jan 1, 2011
240.673
+20.628
9.37%
jan 1, 2012
258.485
+17.812
7.4%
jan 1, 2013
275.703
+17.219
6.66%
jan 1, 2014
293.025
+17.321
6.28%
Ranking of countries by current statistics by years


Comments: