29
/
en
AIzaSyAYiBZKx7MnpbEhh9jyipgxe19OcubqV5w
April 1, 2024
264480
Togo
TGO
true
2
1
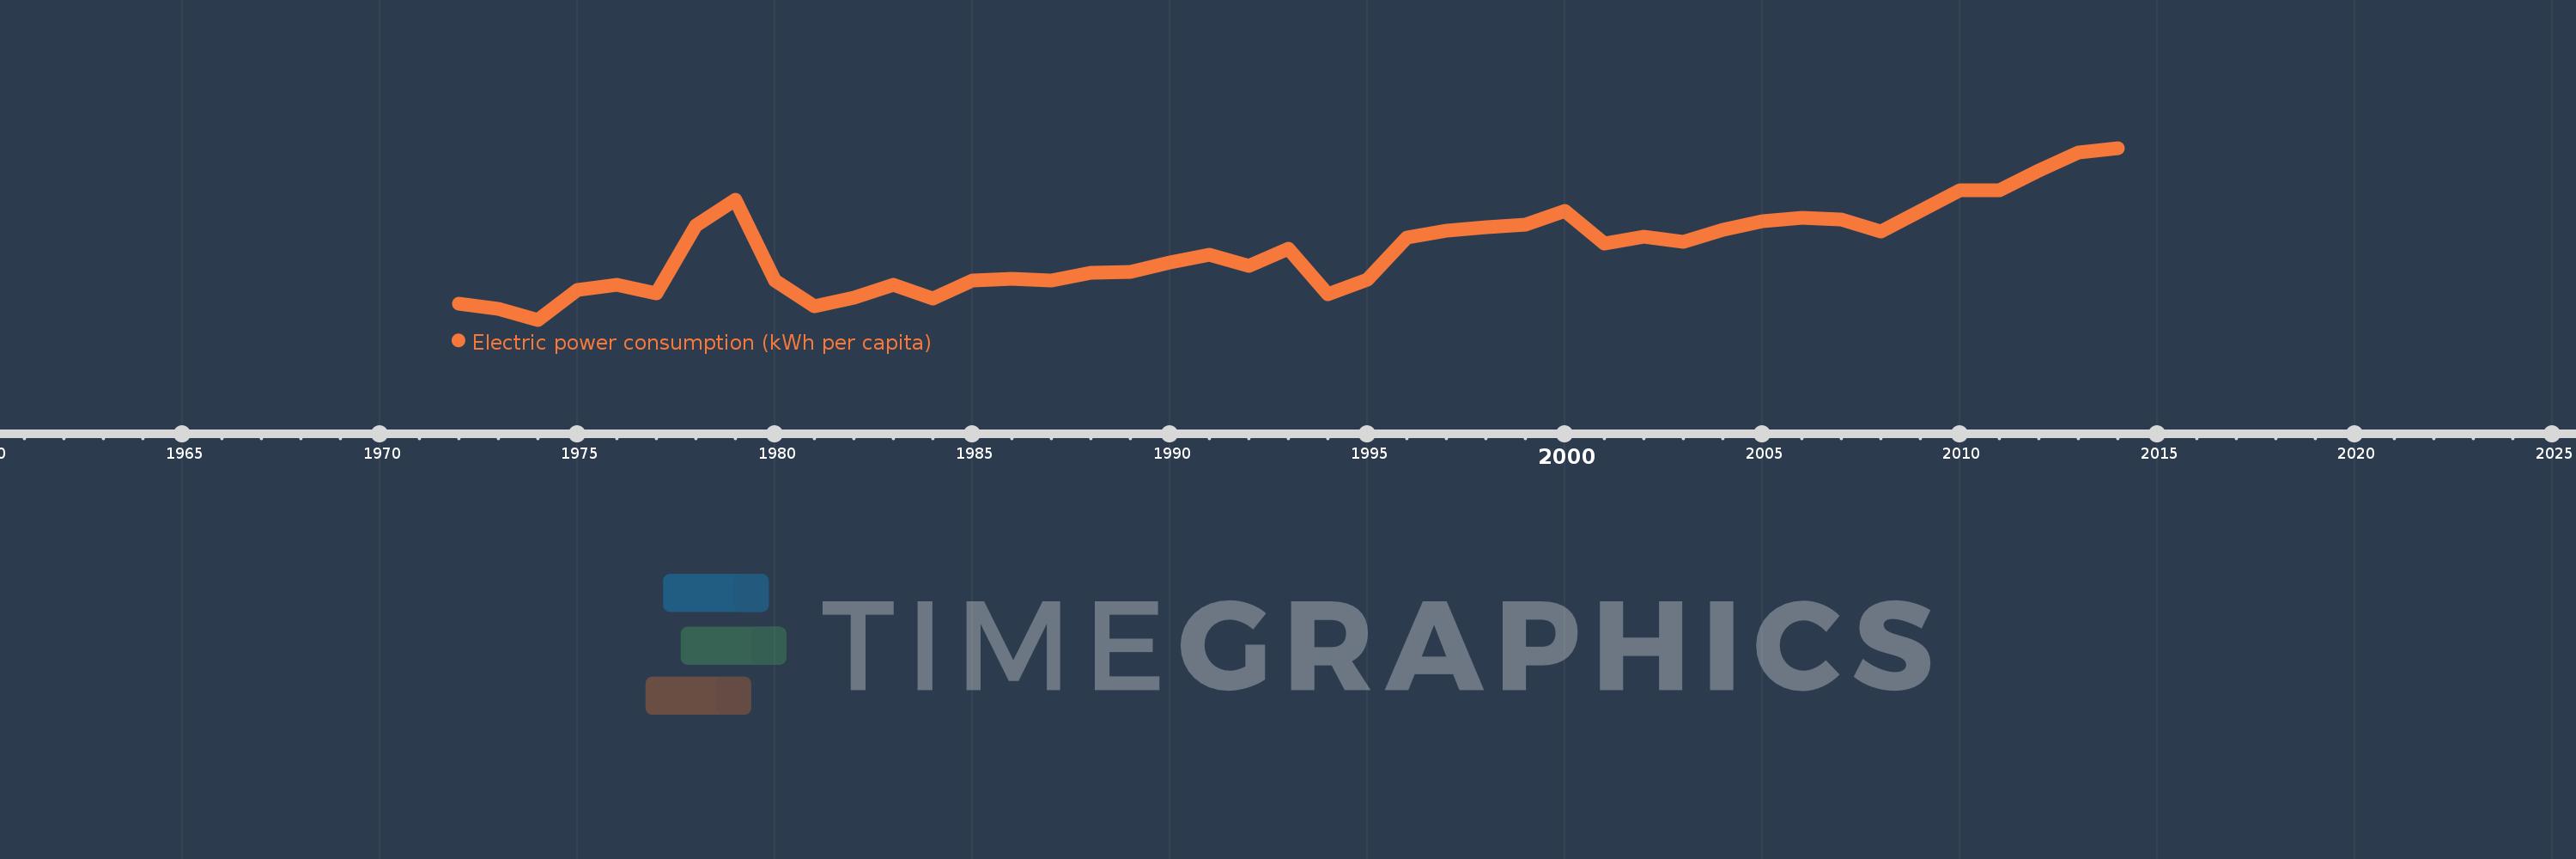
Electric power consumption (kWh per capita)
2014,2013,2012,2011,2010,2008,2007,2006,2005,2004,2003,2002,2001,2000,1999,1998,1997,1996,1995,1994,1993,1992,1991,1990,1989,1988,1987,1986,1985,1984,1983,1982,1981,1980,1979,1978,1977,1976,1975,1974,1973,1972
This statistics in other country:
AlbaniaAlgeriaAngolaArab WorldArgentinaArmeniaAustraliaAustriaAzerbaijanBahrainBangladeshBelarusBelgiumBeninBoliviaBosnia and HerzegovinaBotswanaBrazilBrunei DarussalamBulgariaCambodiaCameroonCanadaCentral Europe and the BalticsChileChinaColombiaCongo, Dem. Rep.Congo, Rep.Costa RicaCote d'IvoireCroatiaCubaCuracaoCyprusCzech RepublicDenmarkDominican RepublicEarly-demographic dividendEast Asia & PacificEast Asia & Pacific (excluding high income)East Asia & Pacific (IDA & IBRD countries)EcuadorEgypt, Arab Rep.El SalvadorEritreaEstoniaEthiopiaEuro areaEurope & Central AsiaEurope & Central Asia (excluding high income)Europe & Central Asia (IDA & IBRD countries)European UnionFinlandFragile and conflict affected situationsFranceGabonGeorgiaGermanyGhanaGibraltarGreeceGuatemalaHaitiHeavily indebted poor countries (HIPC)High incomeHondurasHong Kong SAR, ChinaHungaryIBRD onlyIcelandIDA & IBRD totalIDA blendIDA onlyIDA totalIndiaIndonesiaIran, Islamic Rep.IraqIrelandIsraelItalyJamaicaJapanJordanKazakhstanKenyaKorea, Dem. People’s Rep.Korea, Rep.KosovoKuwaitKyrgyz RepublicLate-demographic dividendLatin America & Caribbean Latin America & Caribbean (excluding high income)Latin America & the Caribbean (IDA & IBRD countries)LatviaLeast developed countries: UN classificationLebanonLibyaLithuaniaLow & middle incomeLower middle incomeLuxembourgMacedonia, FYRMalaysiaMaltaMauritiusMexicoMiddle East & North AfricaMiddle East & North Africa (excluding high income)Middle East & North Africa (IDA & IBRD countries)Middle incomeMoldovaMongoliaMontenegroMoroccoMozambiqueMyanmarNamibiaNepalNetherlandsNew ZealandNicaraguaNigerNigeriaNorth AmericaNorwayOECD membersOmanPakistanPanamaParaguayPeruPhilippinesPolandPortugalPost-demographic dividendPre-demographic dividendQatarRomaniaRussian FederationSaudi ArabiaSenegalSerbiaSingaporeSlovak RepublicSloveniaSouth AfricaSouth AsiaSouth Asia (IDA & IBRD)South SudanSpainSri LankaSub-Saharan Africa Sub-Saharan Africa (excluding high income)Sub-Saharan Africa (IDA & IBRD countries)SudanSwedenSwitzerlandSyrian Arab RepublicTajikistanTanzaniaThailandTogoTrinidad and TobagoTunisiaTurkeyTurkmenistanUkraineUnited Arab EmiratesUnited KingdomUnited StatesUpper middle incomeUruguayUzbekistanVenezuela, RBVietnamWorldYemen, Rep.ZambiaZimbabwe Timeline:
This timeline shows a graph from 1972 to 2014 of Togo. No data until 1971. Number of actual observations by date: 42.
Source name:
World Development Indicators
Source organization:
IEA Statistics © OECD/IEA 2014 (http://www.iea.org/stats/index.asp), subject to https://www.iea.org/t&c/termsandconditions/
Categories, topics:
Energy & Mining, Climate Change, Infrastructure
Last updated:
apr 23, 2017
Indicators value changes by year
Minimum:
55.571
jan 1, 1974
Maximum:
147.502
jan 1, 2014
At the date of observation
Value
Absolute change
Change from previous value
jan 1, 1972
64.054
+64.054
0.0%
jan 1, 1973
61.4
-2.654
-4.14%
jan 1, 1974
55.571
-5.828
-9.49%
jan 1, 1975
71.713
+16.141
29.05%
jan 1, 1976
74.26
+2.547
3.55%
jan 1, 1977
69.792
-4.468
-6.02%
jan 1, 1978
106.013
+36.22
51.9%
jan 1, 1979
119.932
+13.919
13.13%
jan 1, 1980
76.433
-43.499
-36.27%
jan 1, 1981
62.848
-13.584
-17.77%
jan 1, 1982
67.21
+4.362
6.94%
jan 1, 1983
74.096
+6.885
10.24%
jan 1, 1984
67.077
-7.019
-9.47%
jan 1, 1985
76.424
+9.348
13.94%
jan 1, 1986
77.467
+1.043
1.36%
jan 1, 1987
76.707
-0.76
-0.98%
jan 1, 1988
80.922
+4.215
5.5%
jan 1, 1989
81.017
+0.095
0.12%
jan 1, 1990
86.041
+5.023
6.2%
jan 1, 1991
90.574
+4.534
5.27%
jan 1, 1992
84.387
-6.187
-6.83%
jan 1, 1993
93.365
+8.978
10.64%
jan 1, 1994
69.094
-24.271
-26.0%
jan 1, 1995
77.021
+7.927
11.47%
jan 1, 1996
99.433
+22.412
29.1%
jan 1, 1997
103.12
+3.687
3.71%
jan 1, 1998
105.182
+2.062
2.0%
jan 1, 1999
106.599
+1.416
1.35%
jan 1, 2000
113.951
+7.352
6.9%
jan 1, 2001
96.21
-17.74
-15.57%
jan 1, 2002
100.075
+3.865
4.02%
jan 1, 2003
97.231
-2.845
-2.84%
jan 1, 2004
103.913
+6.683
6.87%
jan 1, 2005
108.132
+4.219
4.06%
jan 1, 2006
110.071
+1.939
1.79%
jan 1, 2007
109.034
-1.037
-0.94%
jan 1, 2008
102.879
-6.155
-5.64%
jan 1, 2010
124.764
+21.885
21.27%
jan 1, 2011
124.71
-0.054
-0.04%
jan 1, 2012
135.391
+10.681
8.56%
jan 1, 2013
144.984
+9.593
7.09%
jan 1, 2014
147.502
+2.518
1.74%
Ranking of countries by current statistics by years


Comments: