29
/
en
AIzaSyAYiBZKx7MnpbEhh9jyipgxe19OcubqV5w
April 1, 2024
50812
Middle income
MIC
false
2
1
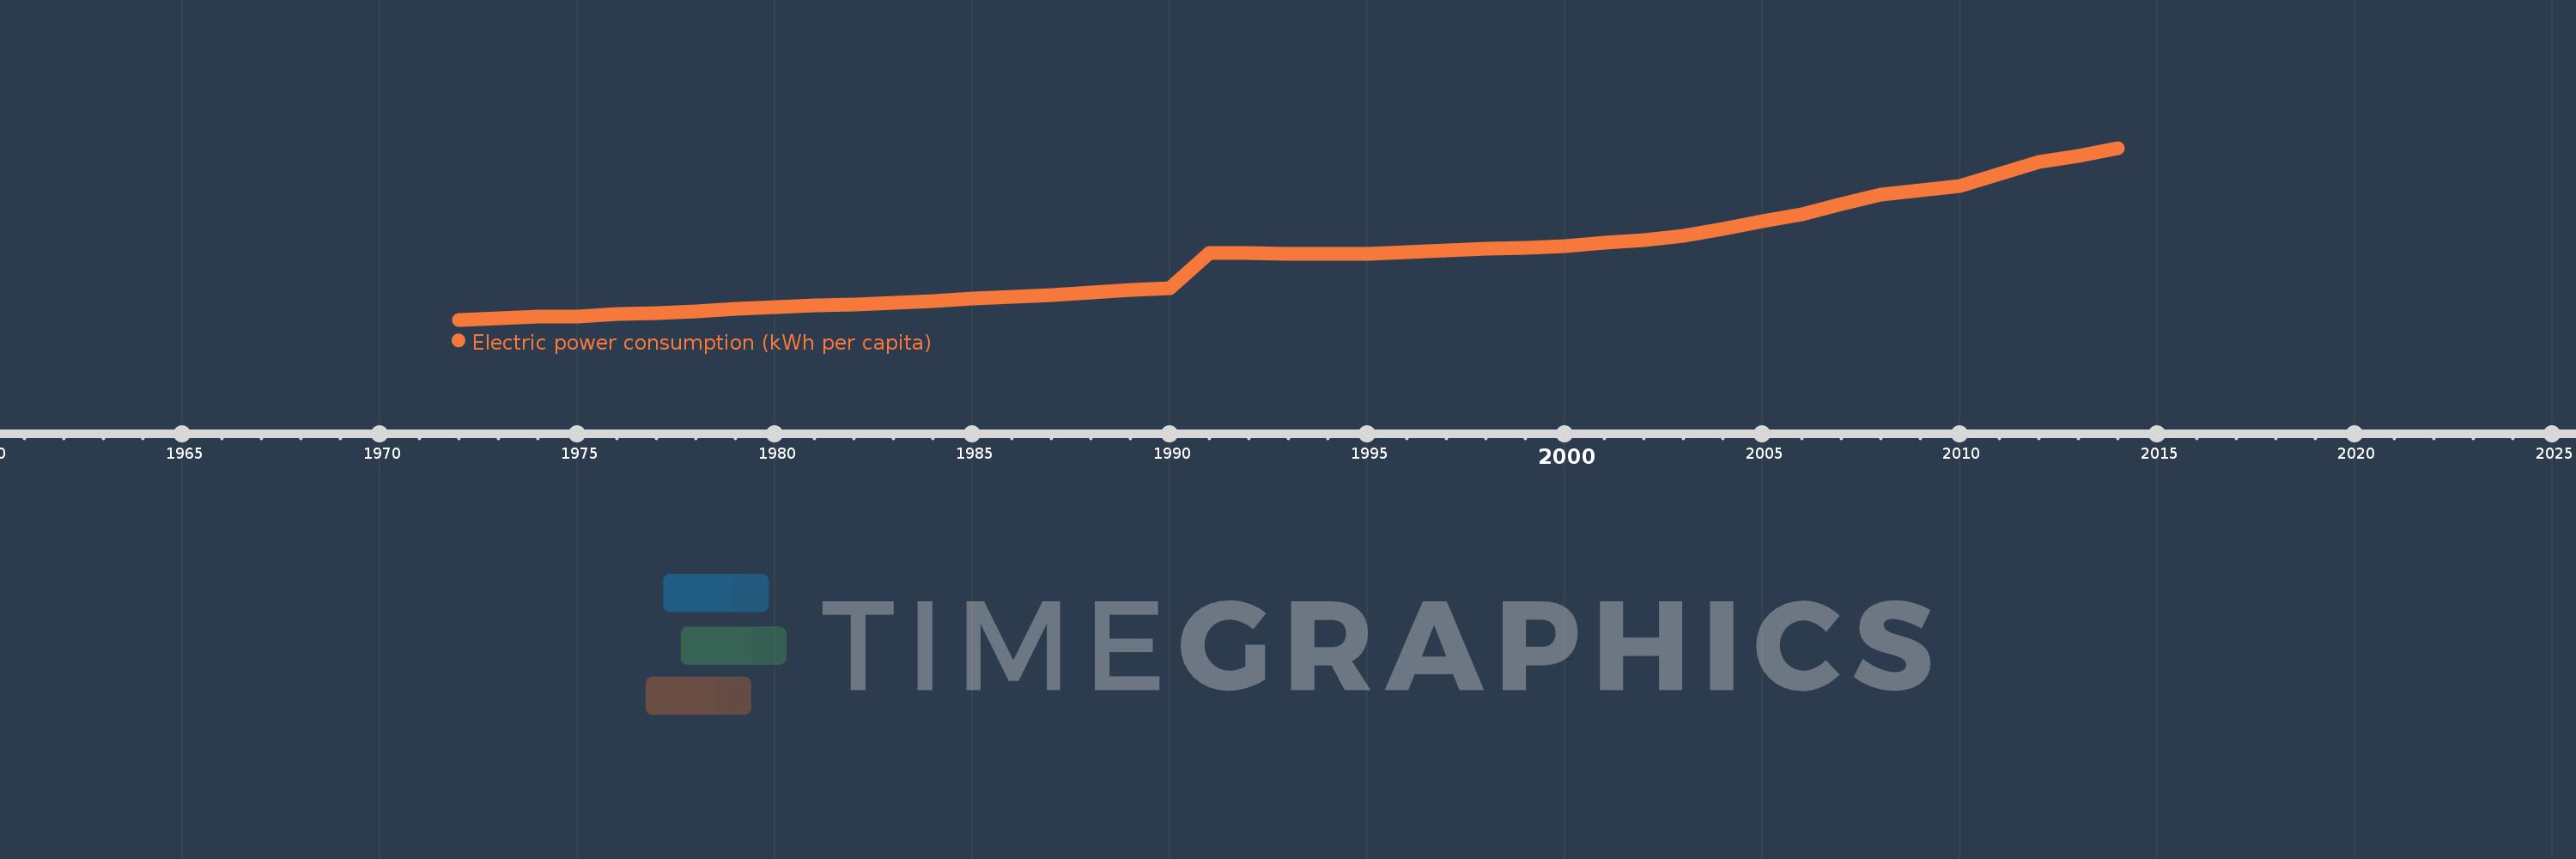
Electric power consumption (kWh per capita)
2014,2013,2012,2011,2010,2009,2008,2007,2006,2005,2004,2003,2002,2001,2000,1999,1998,1997,1996,1995,1994,1993,1992,1991,1990,1989,1988,1987,1986,1985,1984,1983,1982,1981,1980,1979,1978,1977,1976,1975,1974,1973,1972
This statistics in other country:
AlbaniaAlgeriaAngolaArab WorldArgentinaArmeniaAustraliaAustriaAzerbaijanBahrainBangladeshBelarusBelgiumBeninBoliviaBosnia and HerzegovinaBotswanaBrazilBrunei DarussalamBulgariaCambodiaCameroonCanadaCentral Europe and the BalticsChileChinaColombiaCongo, Dem. Rep.Congo, Rep.Costa RicaCote d'IvoireCroatiaCubaCuracaoCyprusCzech RepublicDenmarkDominican RepublicEarly-demographic dividendEast Asia & PacificEast Asia & Pacific (excluding high income)East Asia & Pacific (IDA & IBRD countries)EcuadorEgypt, Arab Rep.El SalvadorEritreaEstoniaEthiopiaEuro areaEurope & Central AsiaEurope & Central Asia (excluding high income)Europe & Central Asia (IDA & IBRD countries)European UnionFinlandFragile and conflict affected situationsFranceGabonGeorgiaGermanyGhanaGibraltarGreeceGuatemalaHaitiHeavily indebted poor countries (HIPC)High incomeHondurasHong Kong SAR, ChinaHungaryIBRD onlyIcelandIDA & IBRD totalIDA blendIDA onlyIDA totalIndiaIndonesiaIran, Islamic Rep.IraqIrelandIsraelItalyJamaicaJapanJordanKazakhstanKenyaKorea, Dem. People’s Rep.Korea, Rep.KosovoKuwaitKyrgyz RepublicLate-demographic dividendLatin America & Caribbean Latin America & Caribbean (excluding high income)Latin America & the Caribbean (IDA & IBRD countries)LatviaLeast developed countries: UN classificationLebanonLibyaLithuaniaLow & middle incomeLower middle incomeLuxembourgMacedonia, FYRMalaysiaMaltaMauritiusMexicoMiddle East & North AfricaMiddle East & North Africa (excluding high income)Middle East & North Africa (IDA & IBRD countries)Middle incomeMoldovaMongoliaMontenegroMoroccoMozambiqueMyanmarNamibiaNepalNetherlandsNew ZealandNicaraguaNigerNigeriaNorth AmericaNorwayOECD membersOmanPakistanPanamaParaguayPeruPhilippinesPolandPortugalPost-demographic dividendPre-demographic dividendQatarRomaniaRussian FederationSaudi ArabiaSenegalSerbiaSingaporeSlovak RepublicSloveniaSouth AfricaSouth AsiaSouth Asia (IDA & IBRD)South SudanSpainSri LankaSub-Saharan Africa Sub-Saharan Africa (excluding high income)Sub-Saharan Africa (IDA & IBRD countries)SudanSwedenSwitzerlandSyrian Arab RepublicTajikistanTanzaniaThailandTogoTrinidad and TobagoTunisiaTurkeyTurkmenistanUkraineUnited Arab EmiratesUnited KingdomUnited StatesUpper middle incomeUruguayUzbekistanVenezuela, RBVietnamWorldYemen, Rep.ZambiaZimbabwe Timeline:
This timeline shows a graph from 1972 to 2014 of Middle income. No data until 1971. Number of actual observations by date: 43.
Source name:
World Development Indicators
Source organization:
IEA Statistics © OECD/IEA 2014 (http://www.iea.org/stats/index.asp), subject to https://www.iea.org/t&c/termsandconditions/
Categories, topics:
Energy & Mining, Climate Change, Infrastructure
Last updated:
apr 23, 2017
Indicators value changes by year
Minimum:
204.555
jan 1, 1972
Maximum:
2.008K
jan 1, 2014
At the date of observation
Value
Absolute change
Change from previous value
jan 1, 1972
204.555
+204.555
0.0%
jan 1, 1973
218.501
+13.947
6.82%
jan 1, 1974
233.543
+15.041
6.88%
jan 1, 1975
242.254
+8.711
3.73%
jan 1, 1976
262.518
+20.264
8.36%
jan 1, 1977
278.202
+15.684
5.97%
jan 1, 1978
295.845
+17.643
6.34%
jan 1, 1979
318.385
+22.541
7.62%
jan 1, 1980
340.169
+21.784
6.84%
jan 1, 1981
358.34
+18.17
5.34%
jan 1, 1982
368.594
+10.255
2.86%
jan 1, 1983
383.126
+14.532
3.94%
jan 1, 1984
399.699
+16.573
4.33%
jan 1, 1985
423.632
+23.933
5.99%
jan 1, 1986
443.41
+19.778
4.67%
jan 1, 1987
467.495
+24.085
5.43%
jan 1, 1988
489.162
+21.667
4.63%
jan 1, 1989
514.961
+25.799
5.27%
jan 1, 1990
533.313
+18.352
3.56%
jan 1, 1991
904.769
+371.456
69.65%
jan 1, 1992
908.044
+3.276
0.36%
jan 1, 1993
899.464
-8.58
-0.94%
jan 1, 1994
895.693
-3.771
-0.42%
jan 1, 1995
896.941
+1.248
0.14%
jan 1, 1996
913.677
+16.735
1.87%
jan 1, 1997
936.231
+22.555
2.47%
jan 1, 1998
952.268
+16.037
1.71%
jan 1, 1999
955.551
+3.283
0.34%
jan 1, 2000
973.119
+17.568
1.84%
jan 1, 2001
1.016K
+42.454
4.36%
jan 1, 2002
1.038K
+22.437
2.21%
jan 1, 2003
1.084K
+46.041
4.44%
jan 1, 2004
1.157K
+72.978
6.73%
jan 1, 2005
1.241K
+83.74
7.24%
jan 1, 2006
1.313K
+72.233
5.82%
jan 1, 2007
1.417K
+104.007
7.92%
jan 1, 2008
1.52K
+103.33
7.29%
jan 1, 2009
1.568K
+47.948
3.15%
jan 1, 2010
1.607K
+38.989
2.49%
jan 1, 2011
1.738K
+130.501
8.12%
jan 1, 2012
1.859K
+121.323
6.98%
jan 1, 2013
1.922K
+63.079
3.39%
jan 1, 2014
2.008K
+86.316
4.49%
Ranking of countries by current statistics by years


Comments: