29
/
en
AIzaSyAYiBZKx7MnpbEhh9jyipgxe19OcubqV5w
April 1, 2024
222053
Peru
PER
true
2
1
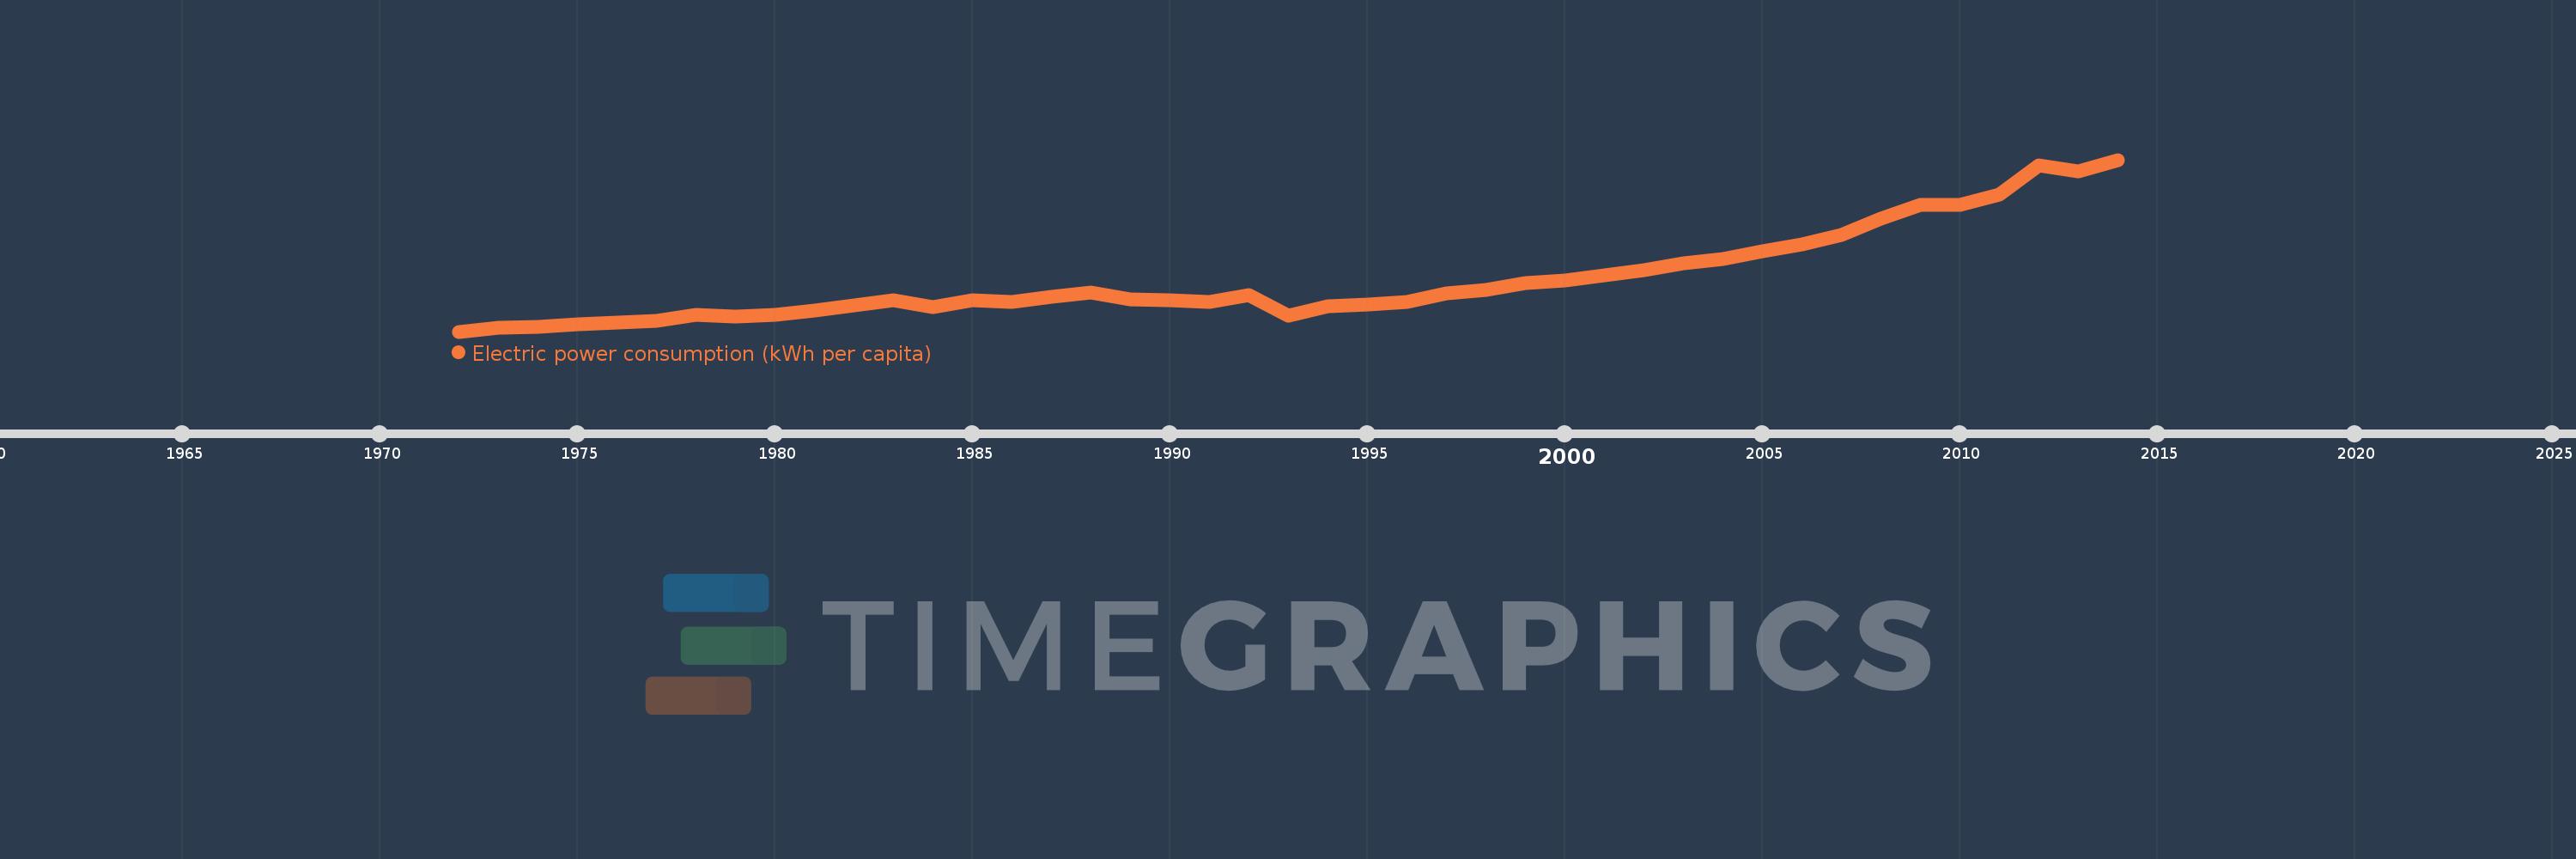
Electric power consumption (kWh per capita)
2014,2013,2012,2011,2010,2009,2008,2007,2006,2005,2004,2003,2002,2001,2000,1999,1998,1997,1996,1995,1994,1993,1992,1991,1990,1989,1988,1987,1986,1985,1984,1983,1982,1981,1980,1979,1978,1977,1976,1975,1974,1973,1972
This statistics in other country:
AlbaniaAlgeriaAngolaArab WorldArgentinaArmeniaAustraliaAustriaAzerbaijanBahrainBangladeshBelarusBelgiumBeninBoliviaBosnia and HerzegovinaBotswanaBrazilBrunei DarussalamBulgariaCambodiaCameroonCanadaCentral Europe and the BalticsChileChinaColombiaCongo, Dem. Rep.Congo, Rep.Costa RicaCote d'IvoireCroatiaCubaCuracaoCyprusCzech RepublicDenmarkDominican RepublicEarly-demographic dividendEast Asia & PacificEast Asia & Pacific (excluding high income)East Asia & Pacific (IDA & IBRD countries)EcuadorEgypt, Arab Rep.El SalvadorEritreaEstoniaEthiopiaEuro areaEurope & Central AsiaEurope & Central Asia (excluding high income)Europe & Central Asia (IDA & IBRD countries)European UnionFinlandFragile and conflict affected situationsFranceGabonGeorgiaGermanyGhanaGibraltarGreeceGuatemalaHaitiHeavily indebted poor countries (HIPC)High incomeHondurasHong Kong SAR, ChinaHungaryIBRD onlyIcelandIDA & IBRD totalIDA blendIDA onlyIDA totalIndiaIndonesiaIran, Islamic Rep.IraqIrelandIsraelItalyJamaicaJapanJordanKazakhstanKenyaKorea, Dem. People’s Rep.Korea, Rep.KosovoKuwaitKyrgyz RepublicLate-demographic dividendLatin America & Caribbean Latin America & Caribbean (excluding high income)Latin America & the Caribbean (IDA & IBRD countries)LatviaLeast developed countries: UN classificationLebanonLibyaLithuaniaLow & middle incomeLower middle incomeLuxembourgMacedonia, FYRMalaysiaMaltaMauritiusMexicoMiddle East & North AfricaMiddle East & North Africa (excluding high income)Middle East & North Africa (IDA & IBRD countries)Middle incomeMoldovaMongoliaMontenegroMoroccoMozambiqueMyanmarNamibiaNepalNetherlandsNew ZealandNicaraguaNigerNigeriaNorth AmericaNorwayOECD membersOmanPakistanPanamaParaguayPeruPhilippinesPolandPortugalPost-demographic dividendPre-demographic dividendQatarRomaniaRussian FederationSaudi ArabiaSenegalSerbiaSingaporeSlovak RepublicSloveniaSouth AfricaSouth AsiaSouth Asia (IDA & IBRD)South SudanSpainSri LankaSub-Saharan Africa Sub-Saharan Africa (excluding high income)Sub-Saharan Africa (IDA & IBRD countries)SudanSwedenSwitzerlandSyrian Arab RepublicTajikistanTanzaniaThailandTogoTrinidad and TobagoTunisiaTurkeyTurkmenistanUkraineUnited Arab EmiratesUnited KingdomUnited StatesUpper middle incomeUruguayUzbekistanVenezuela, RBVietnamWorldYemen, Rep.ZambiaZimbabwe Timeline:
This timeline shows a graph from 1972 to 2014 of Peru. No data until 1971. Number of actual observations by date: 43.
Source name:
World Development Indicators
Source organization:
IEA Statistics © OECD/IEA 2014 (http://www.iea.org/stats/index.asp), subject to https://www.iea.org/t&c/termsandconditions/
Categories, topics:
Energy & Mining, Climate Change, Infrastructure
Last updated:
apr 23, 2017
Indicators value changes by year
Minimum:
394.401
jan 1, 1972
At the date of observation
Value
Absolute change
Change from previous value
jan 1, 1972
394.401
+394.401
0.0%
jan 1, 1973
412.934
+18.533
4.7%
jan 1, 1974
416.746
+3.812
0.92%
jan 1, 1975
433.363
+16.617
3.99%
jan 1, 1976
441.827
+8.464
1.95%
jan 1, 1977
449.683
+7.856
1.78%
jan 1, 1978
477.669
+27.986
6.22%
jan 1, 1979
470.8
-6.869
-1.44%
jan 1, 1980
480.775
+9.975
2.12%
jan 1, 1981
502.848
+22.073
4.59%
jan 1, 1982
529.379
+26.531
5.28%
jan 1, 1983
553.778
+24.399
4.61%
jan 1, 1984
518.262
-35.516
-6.41%
jan 1, 1985
554.41
+36.148
6.97%
jan 1, 1986
547.098
-7.312
-1.32%
jan 1, 1987
569.607
+22.509
4.11%
jan 1, 1988
594.082
+24.475
4.3%
jan 1, 1989
556.579
-37.504
-6.31%
jan 1, 1990
553.703
-2.876
-0.52%
jan 1, 1991
546.35
-7.353
-1.33%
jan 1, 1992
578.958
+32.608
5.97%
jan 1, 1993
475.919
-103.039
-17.8%
jan 1, 1994
522.381
+46.462
9.76%
jan 1, 1995
533.461
+11.08
2.12%
jan 1, 1996
546.368
+12.907
2.42%
jan 1, 1997
588.722
+42.354
7.75%
jan 1, 1998
606.749
+18.027
3.06%
jan 1, 1999
642.149
+35.401
5.83%
jan 1, 2000
655.131
+12.982
2.02%
jan 1, 2001
680.189
+25.057
3.82%
jan 1, 2002
706.056
+25.868
3.8%
jan 1, 2003
740.824
+34.768
4.92%
jan 1, 2004
764.986
+24.162
3.26%
jan 1, 2005
802.84
+37.853
4.95%
jan 1, 2006
837.293
+34.453
4.29%
jan 1, 2007
887.622
+50.329
6.01%
jan 1, 2008
968.127
+80.505
9.07%
jan 1, 2009
1.039K
+71.324
7.37%
jan 1, 2010
1.041K
+1.183
0.11%
jan 1, 2011
1.094K
+53.681
5.16%
jan 1, 2012
1.242K
+147.357
13.47%
jan 1, 2013
1.211K
-30.349
-2.44%
jan 1, 2014
1.27K
+58.444
4.82%
Ranking of countries by current statistics by years


Comments: