29
/
en
AIzaSyAYiBZKx7MnpbEhh9jyipgxe19OcubqV5w
April 1, 2024
267855
Tunisia
TUN
true
2
1
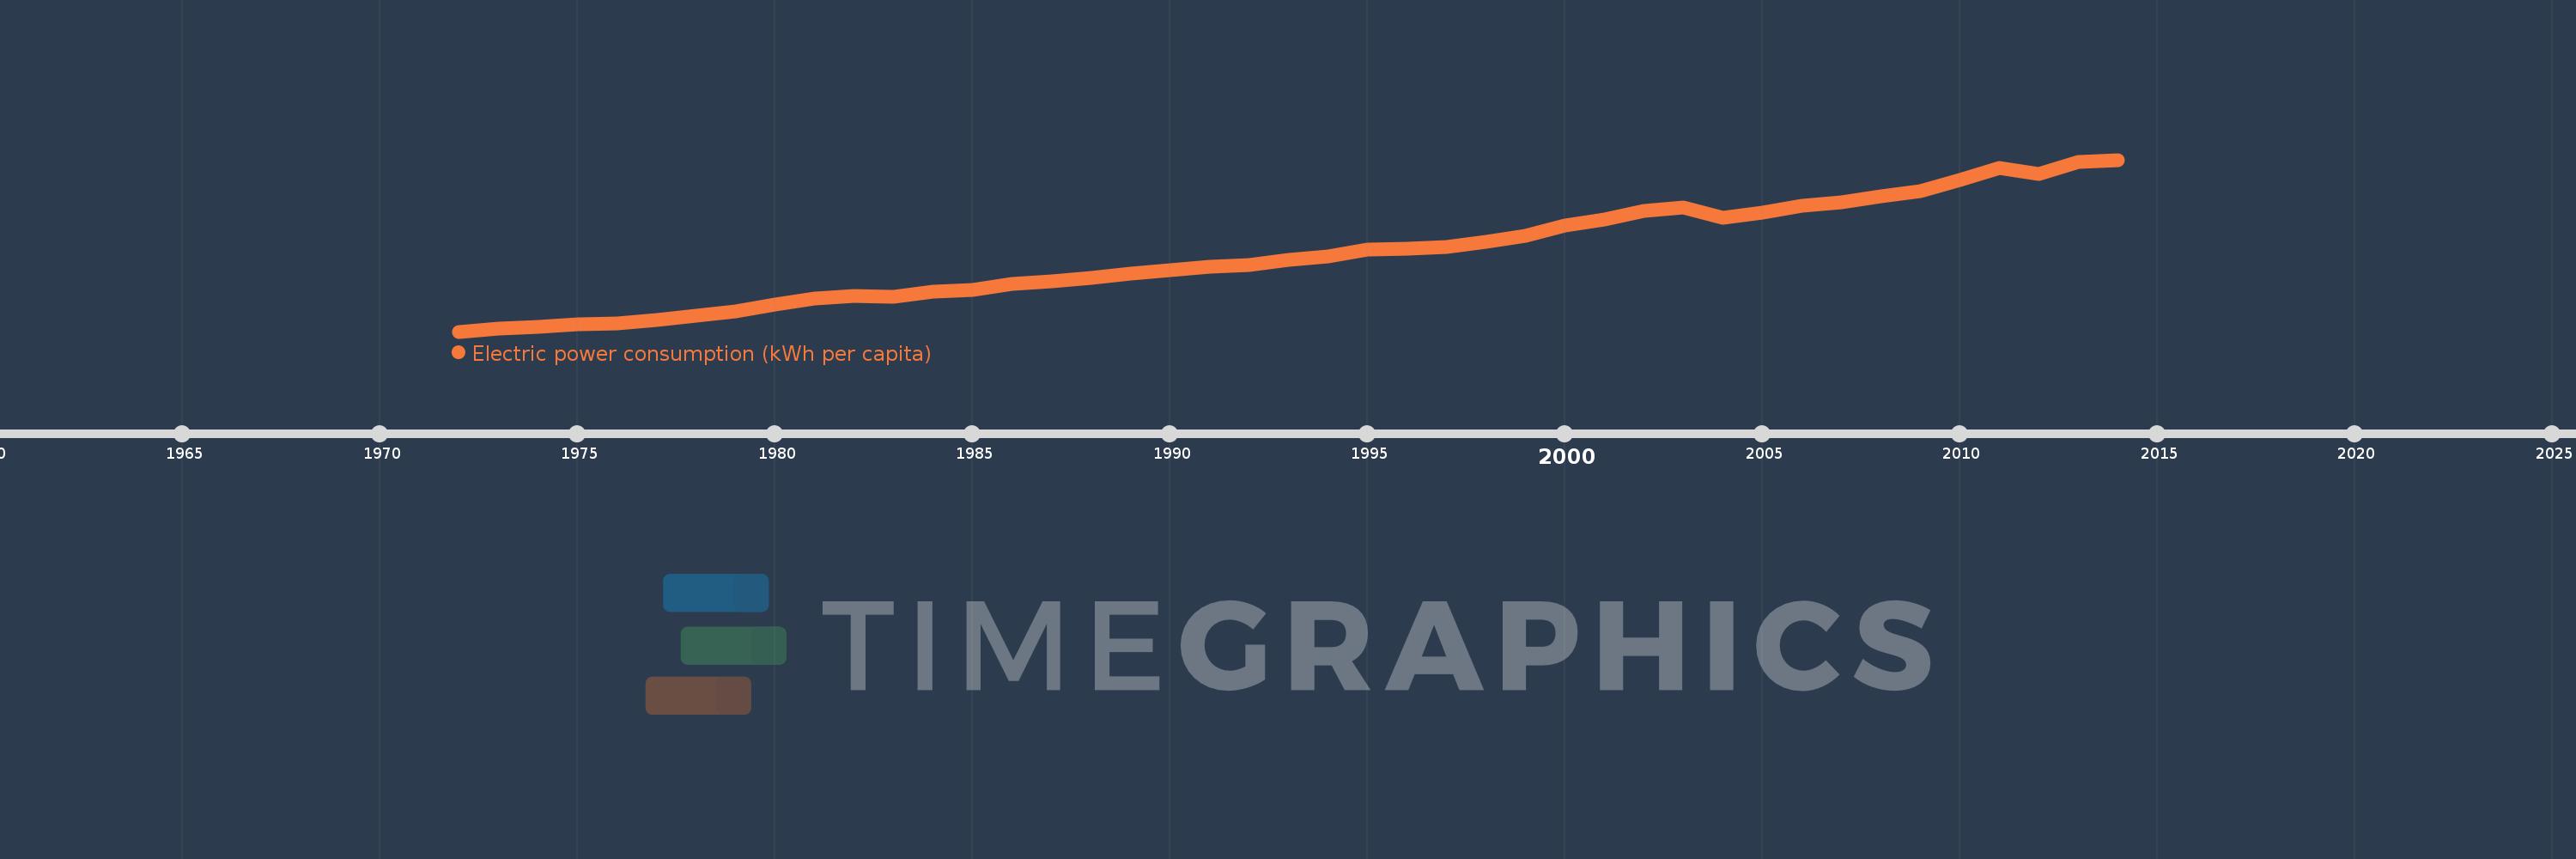
Electric power consumption (kWh per capita)
2014,2013,2012,2011,2010,2009,2008,2007,2006,2005,2004,2003,2002,2001,2000,1999,1998,1997,1996,1995,1994,1993,1992,1991,1990,1989,1988,1987,1986,1985,1984,1983,1982,1981,1980,1979,1978,1977,1976,1975,1974,1973,1972
This statistics in other country:
AlbaniaAlgeriaAngolaArab WorldArgentinaArmeniaAustraliaAustriaAzerbaijanBahrainBangladeshBelarusBelgiumBeninBoliviaBosnia and HerzegovinaBotswanaBrazilBrunei DarussalamBulgariaCambodiaCameroonCanadaCentral Europe and the BalticsChileChinaColombiaCongo, Dem. Rep.Congo, Rep.Costa RicaCote d'IvoireCroatiaCubaCuracaoCyprusCzech RepublicDenmarkDominican RepublicEarly-demographic dividendEast Asia & PacificEast Asia & Pacific (excluding high income)East Asia & Pacific (IDA & IBRD countries)EcuadorEgypt, Arab Rep.El SalvadorEritreaEstoniaEthiopiaEuro areaEurope & Central AsiaEurope & Central Asia (excluding high income)Europe & Central Asia (IDA & IBRD countries)European UnionFinlandFragile and conflict affected situationsFranceGabonGeorgiaGermanyGhanaGibraltarGreeceGuatemalaHaitiHeavily indebted poor countries (HIPC)High incomeHondurasHong Kong SAR, ChinaHungaryIBRD onlyIcelandIDA & IBRD totalIDA blendIDA onlyIDA totalIndiaIndonesiaIran, Islamic Rep.IraqIrelandIsraelItalyJamaicaJapanJordanKazakhstanKenyaKorea, Dem. People’s Rep.Korea, Rep.KosovoKuwaitKyrgyz RepublicLate-demographic dividendLatin America & Caribbean Latin America & Caribbean (excluding high income)Latin America & the Caribbean (IDA & IBRD countries)LatviaLeast developed countries: UN classificationLebanonLibyaLithuaniaLow & middle incomeLower middle incomeLuxembourgMacedonia, FYRMalaysiaMaltaMauritiusMexicoMiddle East & North AfricaMiddle East & North Africa (excluding high income)Middle East & North Africa (IDA & IBRD countries)Middle incomeMoldovaMongoliaMontenegroMoroccoMozambiqueMyanmarNamibiaNepalNetherlandsNew ZealandNicaraguaNigerNigeriaNorth AmericaNorwayOECD membersOmanPakistanPanamaParaguayPeruPhilippinesPolandPortugalPost-demographic dividendPre-demographic dividendQatarRomaniaRussian FederationSaudi ArabiaSenegalSerbiaSingaporeSlovak RepublicSloveniaSouth AfricaSouth AsiaSouth Asia (IDA & IBRD)South SudanSpainSri LankaSub-Saharan Africa Sub-Saharan Africa (excluding high income)Sub-Saharan Africa (IDA & IBRD countries)SudanSwedenSwitzerlandSyrian Arab RepublicTajikistanTanzaniaThailandTogoTrinidad and TobagoTunisiaTurkeyTurkmenistanUkraineUnited Arab EmiratesUnited KingdomUnited StatesUpper middle incomeUruguayUzbekistanVenezuela, RBVietnamWorldYemen, Rep.ZambiaZimbabwe Timeline:
This timeline shows a graph from 1972 to 2014 of Tunisia. No data until 1971. Number of actual observations by date: 43.
Source name:
World Development Indicators
Source organization:
IEA Statistics © OECD/IEA 2014 (http://www.iea.org/stats/index.asp), subject to https://www.iea.org/t&c/termsandconditions/
Categories, topics:
Energy & Mining, Climate Change, Infrastructure
Last updated:
apr 23, 2017
Indicators value changes by year
Minimum:
154.181
jan 1, 1972
Maximum:
1.435K
jan 1, 2014
At the date of observation
Value
Absolute change
Change from previous value
jan 1, 1972
154.181
+154.181
0.0%
jan 1, 1973
174.904
+20.723
13.44%
jan 1, 1974
192.254
+17.35
9.92%
jan 1, 1975
206.781
+14.528
7.56%
jan 1, 1976
216.539
+9.757
4.72%
jan 1, 1977
241.017
+24.478
11.3%
jan 1, 1978
274.547
+33.531
13.91%
jan 1, 1979
302.998
+28.451
10.36%
jan 1, 1980
354.104
+51.106
16.87%
jan 1, 1981
402.099
+47.995
13.55%
jan 1, 1982
422.414
+20.315
5.05%
jan 1, 1983
410.451
-11.962
-2.83%
jan 1, 1984
450.534
+40.083
9.77%
jan 1, 1985
467.16
+16.626
3.69%
jan 1, 1986
511.132
+43.971
9.41%
jan 1, 1987
530.788
+19.656
3.85%
jan 1, 1988
553.954
+23.166
4.36%
jan 1, 1989
586.183
+32.228
5.82%
jan 1, 1990
611.281
+25.099
4.28%
jan 1, 1991
638.428
+27.147
4.44%
jan 1, 1992
651.703
+13.275
2.08%
jan 1, 1993
687.405
+35.702
5.48%
jan 1, 1994
717.319
+29.914
4.35%
jan 1, 1995
766.814
+49.495
6.9%
jan 1, 1996
774.881
+8.067
1.05%
jan 1, 1997
785.979
+11.098
1.43%
jan 1, 1998
826.162
+40.183
5.11%
jan 1, 1999
868.182
+42.02
5.09%
jan 1, 2000
947.451
+79.269
9.13%
jan 1, 2001
992.41
+44.96
4.75%
jan 1, 2002
1.051K
+58.302
5.87%
jan 1, 2003
1.08K
+28.795
2.74%
jan 1, 2004
1.004K
-75.319
-6.98%
jan 1, 2005
1.044K
+39.77
3.96%
jan 1, 2006
1.092K
+47.976
4.6%
jan 1, 2007
1.116K
+23.698
2.17%
jan 1, 2008
1.16K
+44.358
3.98%
jan 1, 2009
1.199K
+38.784
3.34%
jan 1, 2010
1.285K
+85.855
7.16%
jan 1, 2011
1.376K
+91.77
7.14%
jan 1, 2012
1.331K
-44.913
-3.26%
jan 1, 2013
1.418K
+86.47
6.49%
jan 1, 2014
1.435K
+16.667
1.18%
Ranking of countries by current statistics by years


Comments: