29
/
en
AIzaSyAYiBZKx7MnpbEhh9jyipgxe19OcubqV5w
April 1, 2024
155857
Indonesia
IDN
true
2
1
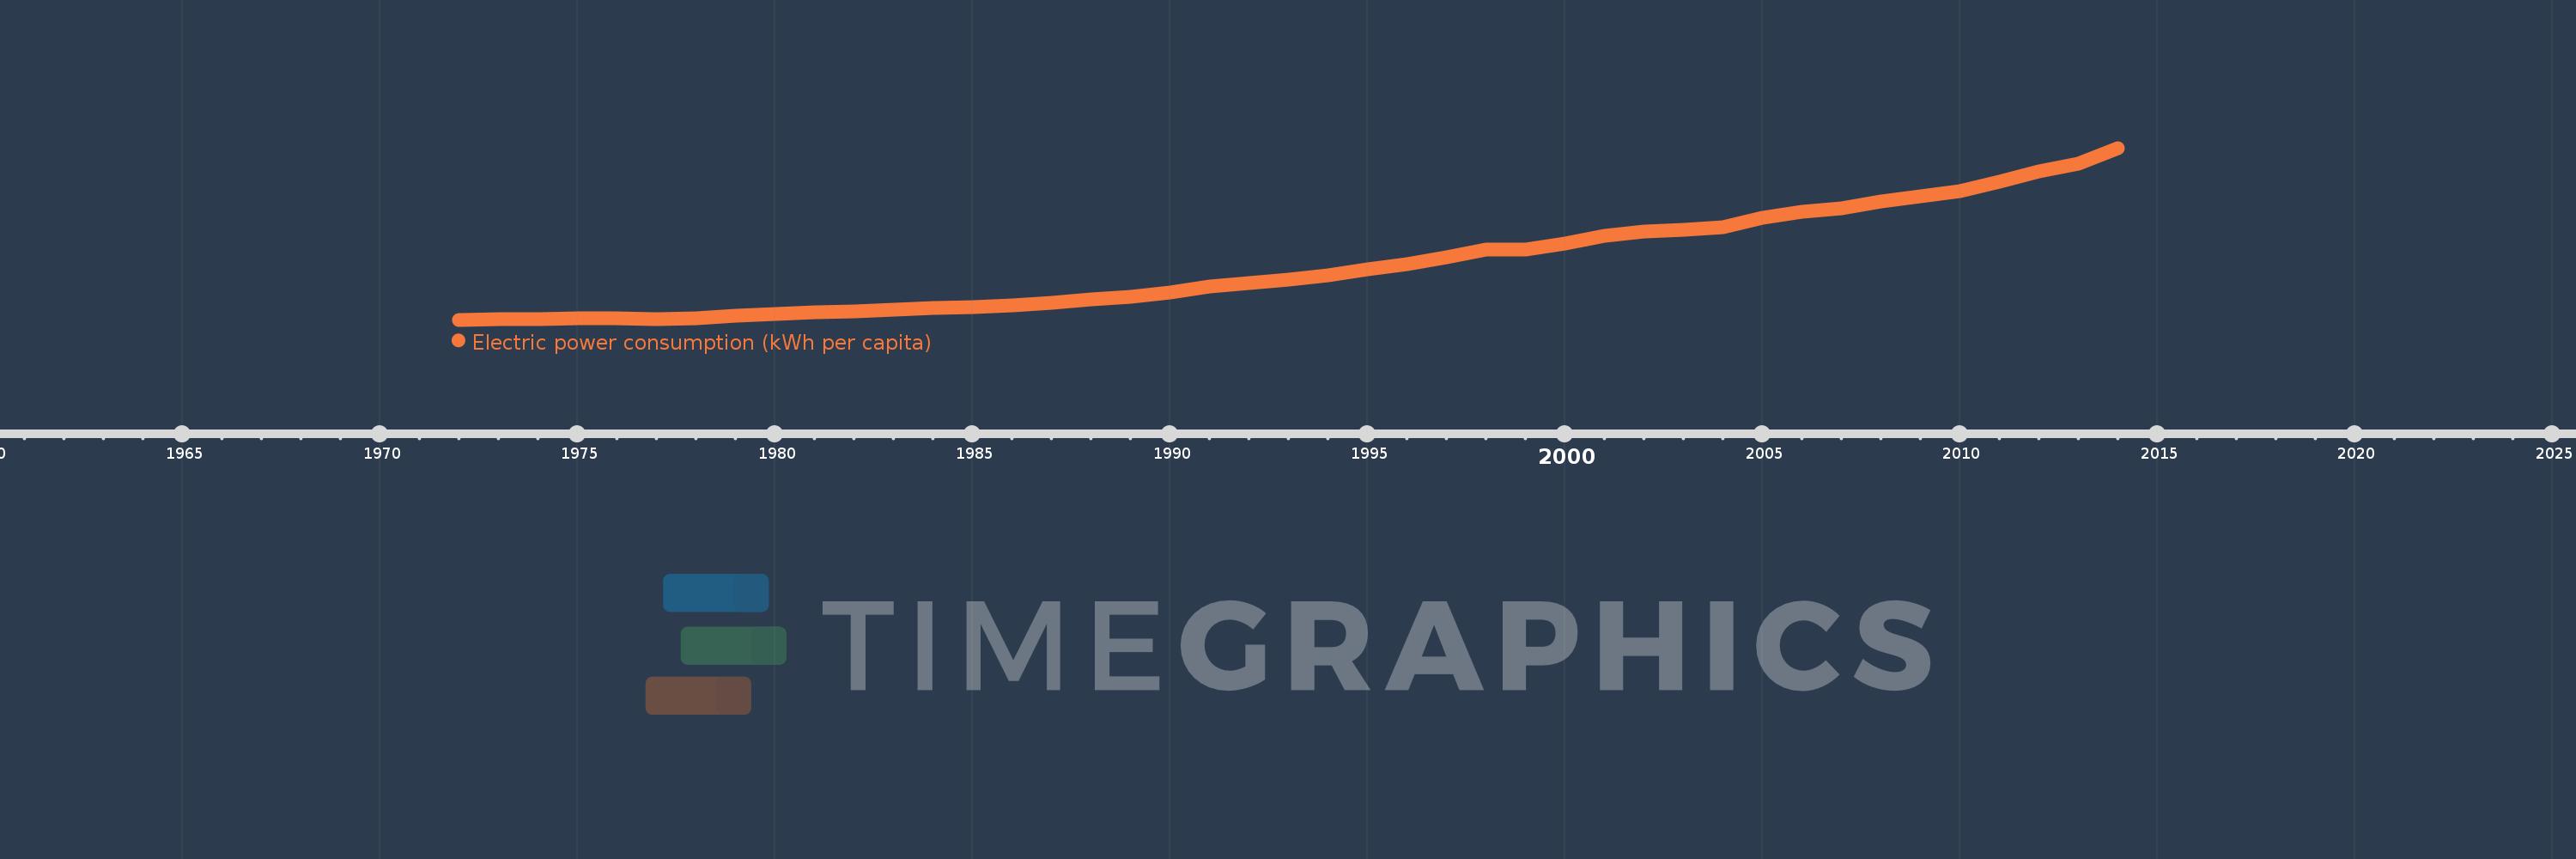
Electric power consumption (kWh per capita)
2014,2013,2012,2011,2010,2009,2008,2007,2006,2005,2004,2003,2002,2001,2000,1999,1998,1997,1996,1995,1994,1993,1992,1991,1990,1989,1988,1987,1986,1985,1984,1983,1982,1981,1980,1979,1978,1977,1976,1975,1974,1973,1972
This statistics in other country:
AlbaniaAlgeriaAngolaArab WorldArgentinaArmeniaAustraliaAustriaAzerbaijanBahrainBangladeshBelarusBelgiumBeninBoliviaBosnia and HerzegovinaBotswanaBrazilBrunei DarussalamBulgariaCambodiaCameroonCanadaCentral Europe and the BalticsChileChinaColombiaCongo, Dem. Rep.Congo, Rep.Costa RicaCote d'IvoireCroatiaCubaCuracaoCyprusCzech RepublicDenmarkDominican RepublicEarly-demographic dividendEast Asia & PacificEast Asia & Pacific (excluding high income)East Asia & Pacific (IDA & IBRD countries)EcuadorEgypt, Arab Rep.El SalvadorEritreaEstoniaEthiopiaEuro areaEurope & Central AsiaEurope & Central Asia (excluding high income)Europe & Central Asia (IDA & IBRD countries)European UnionFinlandFragile and conflict affected situationsFranceGabonGeorgiaGermanyGhanaGibraltarGreeceGuatemalaHaitiHeavily indebted poor countries (HIPC)High incomeHondurasHong Kong SAR, ChinaHungaryIBRD onlyIcelandIDA & IBRD totalIDA blendIDA onlyIDA totalIndiaIndonesiaIran, Islamic Rep.IraqIrelandIsraelItalyJamaicaJapanJordanKazakhstanKenyaKorea, Dem. People’s Rep.Korea, Rep.KosovoKuwaitKyrgyz RepublicLate-demographic dividendLatin America & Caribbean Latin America & Caribbean (excluding high income)Latin America & the Caribbean (IDA & IBRD countries)LatviaLeast developed countries: UN classificationLebanonLibyaLithuaniaLow & middle incomeLower middle incomeLuxembourgMacedonia, FYRMalaysiaMaltaMauritiusMexicoMiddle East & North AfricaMiddle East & North Africa (excluding high income)Middle East & North Africa (IDA & IBRD countries)Middle incomeMoldovaMongoliaMontenegroMoroccoMozambiqueMyanmarNamibiaNepalNetherlandsNew ZealandNicaraguaNigerNigeriaNorth AmericaNorwayOECD membersOmanPakistanPanamaParaguayPeruPhilippinesPolandPortugalPost-demographic dividendPre-demographic dividendQatarRomaniaRussian FederationSaudi ArabiaSenegalSerbiaSingaporeSlovak RepublicSloveniaSouth AfricaSouth AsiaSouth Asia (IDA & IBRD)South SudanSpainSri LankaSub-Saharan Africa Sub-Saharan Africa (excluding high income)Sub-Saharan Africa (IDA & IBRD countries)SudanSwedenSwitzerlandSyrian Arab RepublicTajikistanTanzaniaThailandTogoTrinidad and TobagoTunisiaTurkeyTurkmenistanUkraineUnited Arab EmiratesUnited KingdomUnited StatesUpper middle incomeUruguayUzbekistanVenezuela, RBVietnamWorldYemen, Rep.ZambiaZimbabwe Timeline:
This timeline shows a graph from 1972 to 2014 of Indonesia. No data until 1971. Number of actual observations by date: 43.
Source name:
World Development Indicators
Source organization:
IEA Statistics © OECD/IEA 2014 (http://www.iea.org/stats/index.asp), subject to https://www.iea.org/t&c/termsandconditions/
Categories, topics:
Energy & Mining, Climate Change, Infrastructure
Last updated:
apr 23, 2017
Indicators value changes by year
Minimum:
14.348
jan 1, 1972
Maximum:
787.68
jan 1, 2014
At the date of observation
Value
Absolute change
Change from previous value
jan 1, 1972
14.348
+14.348
0.0%
jan 1, 1973
15.893
+1.545
10.76%
jan 1, 1974
15.816
-0.077
-0.49%
jan 1, 1975
19.182
+3.366
21.28%
jan 1, 1976
21.442
+2.26
11.78%
jan 1, 1977
18.327
-3.115
-14.53%
jan 1, 1978
21.723
+3.396
18.53%
jan 1, 1979
31.749
+10.026
46.16%
jan 1, 1980
38.673
+6.924
21.81%
jan 1, 1981
46.159
+7.486
19.36%
jan 1, 1982
52.266
+6.107
13.23%
jan 1, 1983
61.415
+9.149
17.51%
jan 1, 1984
66.083
+4.668
7.6%
jan 1, 1985
71.431
+5.348
8.09%
jan 1, 1986
79.746
+8.315
11.64%
jan 1, 1987
92.042
+12.296
15.42%
jan 1, 1988
104.339
+12.297
13.36%
jan 1, 1989
119.519
+15.181
14.55%
jan 1, 1990
137.494
+17.975
15.04%
jan 1, 1991
162.503
+25.009
18.19%
jan 1, 1992
177.933
+15.43
9.5%
jan 1, 1993
194.31
+16.377
9.2%
jan 1, 1994
212.827
+18.517
9.53%
jan 1, 1995
240.018
+27.191
12.78%
jan 1, 1996
263.589
+23.572
9.82%
jan 1, 1997
297.164
+33.575
12.74%
jan 1, 1998
331.253
+34.089
11.47%
jan 1, 1999
331.066
-0.187
-0.06%
jan 1, 2000
356.972
+25.905
7.82%
jan 1, 2001
390.375
+33.403
9.36%
jan 1, 2002
411.428
+21.053
5.39%
jan 1, 2003
417.474
+6.046
1.47%
jan 1, 2004
428.859
+11.385
2.73%
jan 1, 2005
474.411
+45.552
10.62%
jan 1, 2006
500.723
+26.313
5.55%
jan 1, 2007
516.156
+15.433
3.08%
jan 1, 2008
546.335
+30.179
5.85%
jan 1, 2009
570.324
+23.989
4.39%
jan 1, 2010
594.326
+24.001
4.21%
jan 1, 2011
636.551
+42.225
7.1%
jan 1, 2012
680.676
+44.125
6.93%
jan 1, 2013
718.685
+38.009
5.58%
jan 1, 2014
787.68
+68.995
9.6%
Ranking of countries by current statistics by years


Comments: