29
/
en
AIzaSyAYiBZKx7MnpbEhh9jyipgxe19OcubqV5w
April 1, 2024
144242
Guatemala
GTM
true
2
1
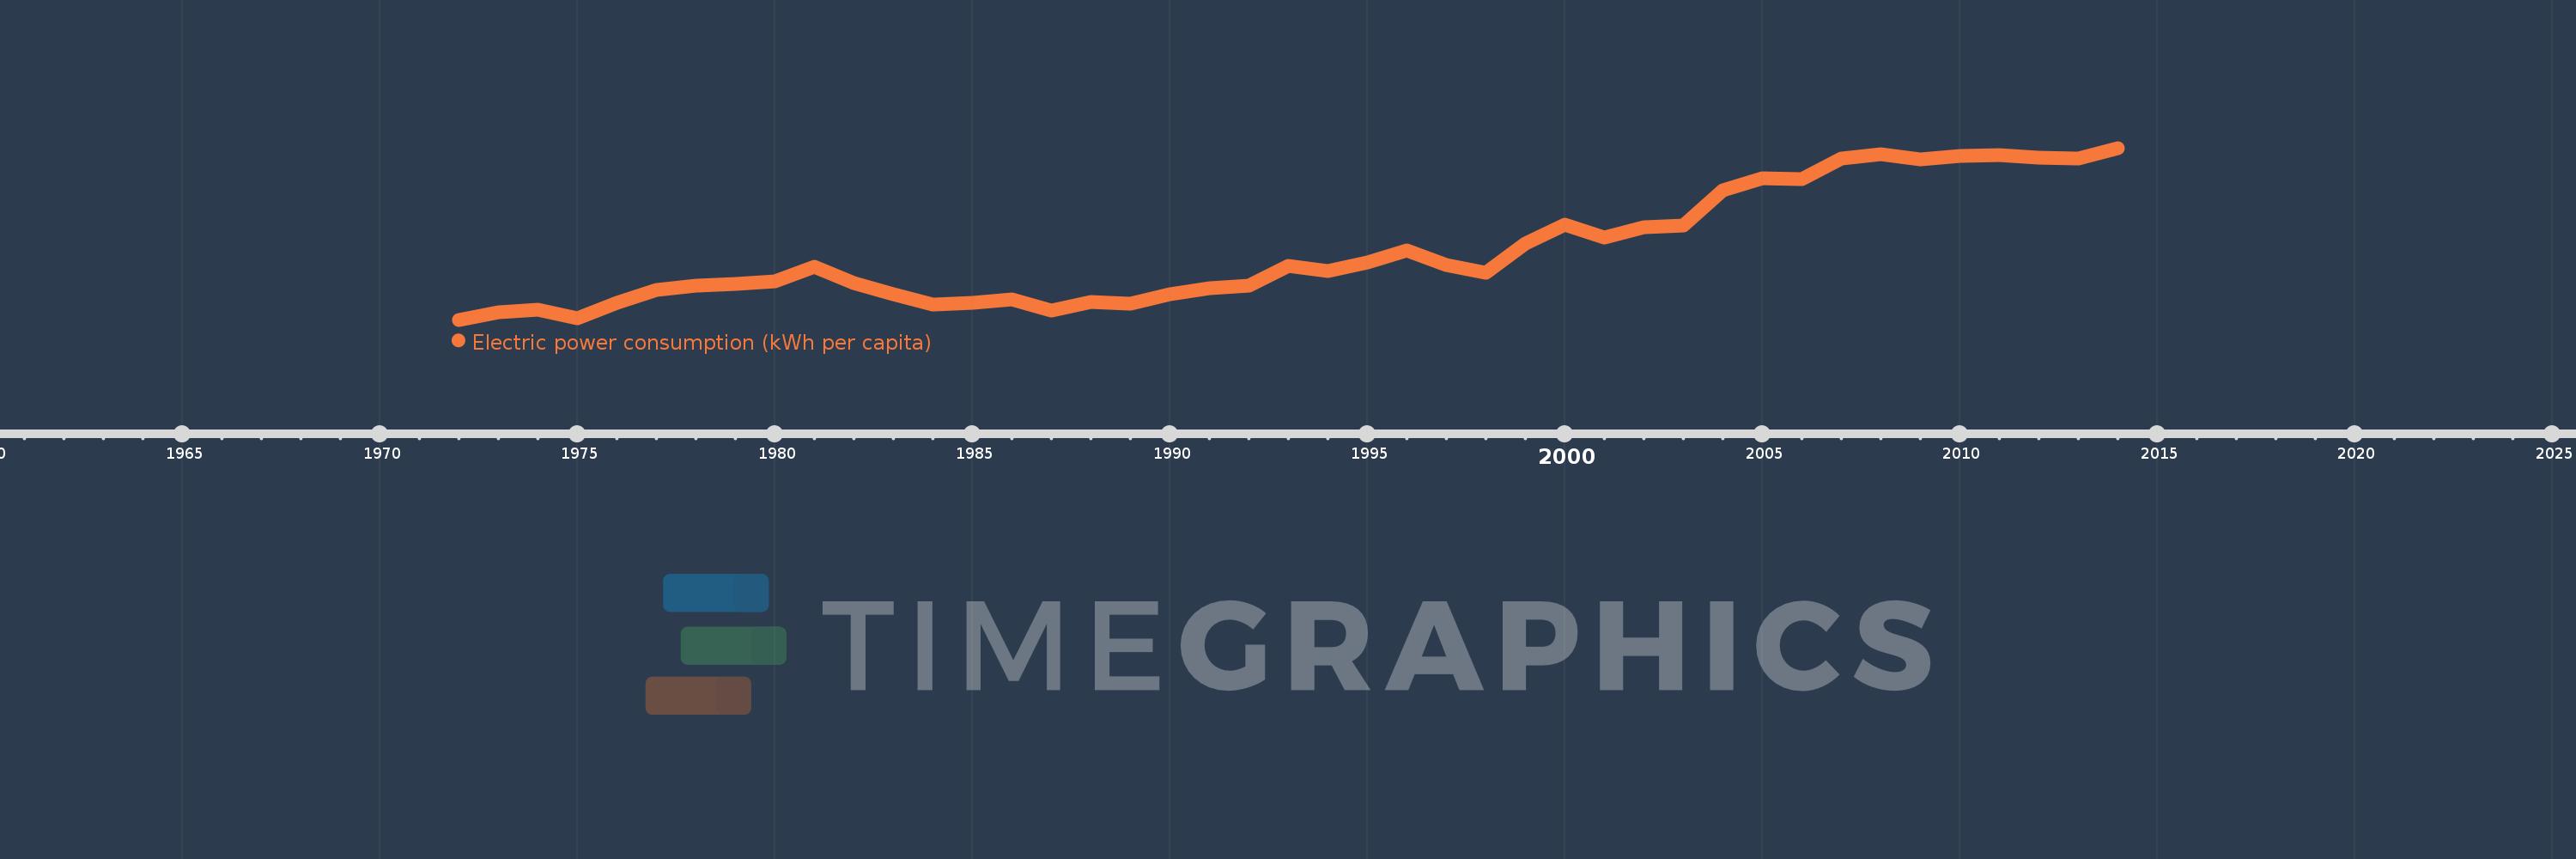
Electric power consumption (kWh per capita)
2014,2013,2012,2011,2010,2009,2008,2007,2006,2005,2004,2003,2002,2001,2000,1999,1998,1997,1996,1995,1994,1993,1992,1991,1990,1989,1988,1987,1986,1985,1984,1983,1982,1981,1980,1979,1978,1977,1976,1975,1974,1973,1972
This statistics in other country:
AlbaniaAlgeriaAngolaArab WorldArgentinaArmeniaAustraliaAustriaAzerbaijanBahrainBangladeshBelarusBelgiumBeninBoliviaBosnia and HerzegovinaBotswanaBrazilBrunei DarussalamBulgariaCambodiaCameroonCanadaCentral Europe and the BalticsChileChinaColombiaCongo, Dem. Rep.Congo, Rep.Costa RicaCote d'IvoireCroatiaCubaCuracaoCyprusCzech RepublicDenmarkDominican RepublicEarly-demographic dividendEast Asia & PacificEast Asia & Pacific (excluding high income)East Asia & Pacific (IDA & IBRD countries)EcuadorEgypt, Arab Rep.El SalvadorEritreaEstoniaEthiopiaEuro areaEurope & Central AsiaEurope & Central Asia (excluding high income)Europe & Central Asia (IDA & IBRD countries)European UnionFinlandFragile and conflict affected situationsFranceGabonGeorgiaGermanyGhanaGibraltarGreeceGuatemalaHaitiHeavily indebted poor countries (HIPC)High incomeHondurasHong Kong SAR, ChinaHungaryIBRD onlyIcelandIDA & IBRD totalIDA blendIDA onlyIDA totalIndiaIndonesiaIran, Islamic Rep.IraqIrelandIsraelItalyJamaicaJapanJordanKazakhstanKenyaKorea, Dem. People’s Rep.Korea, Rep.KosovoKuwaitKyrgyz RepublicLate-demographic dividendLatin America & Caribbean Latin America & Caribbean (excluding high income)Latin America & the Caribbean (IDA & IBRD countries)LatviaLeast developed countries: UN classificationLebanonLibyaLithuaniaLow & middle incomeLower middle incomeLuxembourgMacedonia, FYRMalaysiaMaltaMauritiusMexicoMiddle East & North AfricaMiddle East & North Africa (excluding high income)Middle East & North Africa (IDA & IBRD countries)Middle incomeMoldovaMongoliaMontenegroMoroccoMozambiqueMyanmarNamibiaNepalNetherlandsNew ZealandNicaraguaNigerNigeriaNorth AmericaNorwayOECD membersOmanPakistanPanamaParaguayPeruPhilippinesPolandPortugalPost-demographic dividendPre-demographic dividendQatarRomaniaRussian FederationSaudi ArabiaSenegalSerbiaSingaporeSlovak RepublicSloveniaSouth AfricaSouth AsiaSouth Asia (IDA & IBRD)South SudanSpainSri LankaSub-Saharan Africa Sub-Saharan Africa (excluding high income)Sub-Saharan Africa (IDA & IBRD countries)SudanSwedenSwitzerlandSyrian Arab RepublicTajikistanTanzaniaThailandTogoTrinidad and TobagoTunisiaTurkeyTurkmenistanUkraineUnited Arab EmiratesUnited KingdomUnited StatesUpper middle incomeUruguayUzbekistanVenezuela, RBVietnamWorldYemen, Rep.ZambiaZimbabwe Timeline:
This timeline shows a graph from 1972 to 2014 of Guatemala. No data until 1971. Number of actual observations by date: 43.
Source name:
World Development Indicators
Source organization:
IEA Statistics © OECD/IEA 2014 (http://www.iea.org/stats/index.asp), subject to https://www.iea.org/t&c/termsandconditions/
Categories, topics:
Energy & Mining, Climate Change, Infrastructure
Last updated:
apr 23, 2017
Indicators value changes by year
Minimum:
123.704
jan 1, 1972
Maximum:
555.039
jan 1, 2014
At the date of observation
Value
Absolute change
Change from previous value
jan 1, 1972
123.704
+123.704
0.0%
jan 1, 1973
142.391
+18.687
15.11%
jan 1, 1974
149.95
+7.559
5.31%
jan 1, 1975
126.378
-23.571
-15.72%
jan 1, 1976
166.881
+40.503
32.05%
jan 1, 1977
198.657
+31.776
19.04%
jan 1, 1978
209.432
+10.775
5.42%
jan 1, 1979
213.791
+4.359
2.08%
jan 1, 1980
219.947
+6.156
2.88%
jan 1, 1981
257.634
+37.687
17.13%
jan 1, 1982
216.404
-41.23
-16.0%
jan 1, 1983
188.595
-27.809
-12.85%
jan 1, 1984
162.384
-26.211
-13.9%
jan 1, 1985
166.923
+4.54
2.8%
jan 1, 1986
175.547
+8.623
5.17%
jan 1, 1987
146.265
-29.281
-16.68%
jan 1, 1988
167.297
+21.031
14.38%
jan 1, 1989
164.96
-2.337
-1.4%
jan 1, 1990
188.808
+23.849
14.46%
jan 1, 1991
202.761
+13.953
7.39%
jan 1, 1992
208.631
+5.869
2.89%
jan 1, 1993
258.86
+50.229
24.08%
jan 1, 1994
245.029
-13.831
-5.34%
jan 1, 1995
268.145
+23.116
9.43%
jan 1, 1996
297.084
+28.938
10.79%
jan 1, 1997
260.076
-37.008
-12.46%
jan 1, 1998
240.899
-19.177
-7.37%
jan 1, 1999
314.542
+73.644
30.57%
jan 1, 2000
362.439
+47.897
15.23%
jan 1, 2001
329.379
-33.06
-9.12%
jan 1, 2002
356.441
+27.062
8.22%
jan 1, 2003
361.141
+4.7
1.32%
jan 1, 2004
448.17
+87.029
24.1%
jan 1, 2005
479.511
+31.34
6.99%
jan 1, 2006
477.491
-2.02
-0.42%
jan 1, 2007
529.353
+51.863
10.86%
jan 1, 2008
539.658
+10.304
1.95%
jan 1, 2009
526.771
-12.886
-2.39%
jan 1, 2010
533.984
+7.213
1.37%
jan 1, 2011
538.207
+4.223
0.79%
jan 1, 2012
530.989
-7.218
-1.34%
jan 1, 2013
529.255
-1.733
-0.33%
jan 1, 2014
555.039
+25.783
4.87%
Ranking of countries by current statistics by years


Comments: