29
/
en
AIzaSyAYiBZKx7MnpbEhh9jyipgxe19OcubqV5w
April 1, 2024
248583
Sri Lanka
LKA
true
2
1
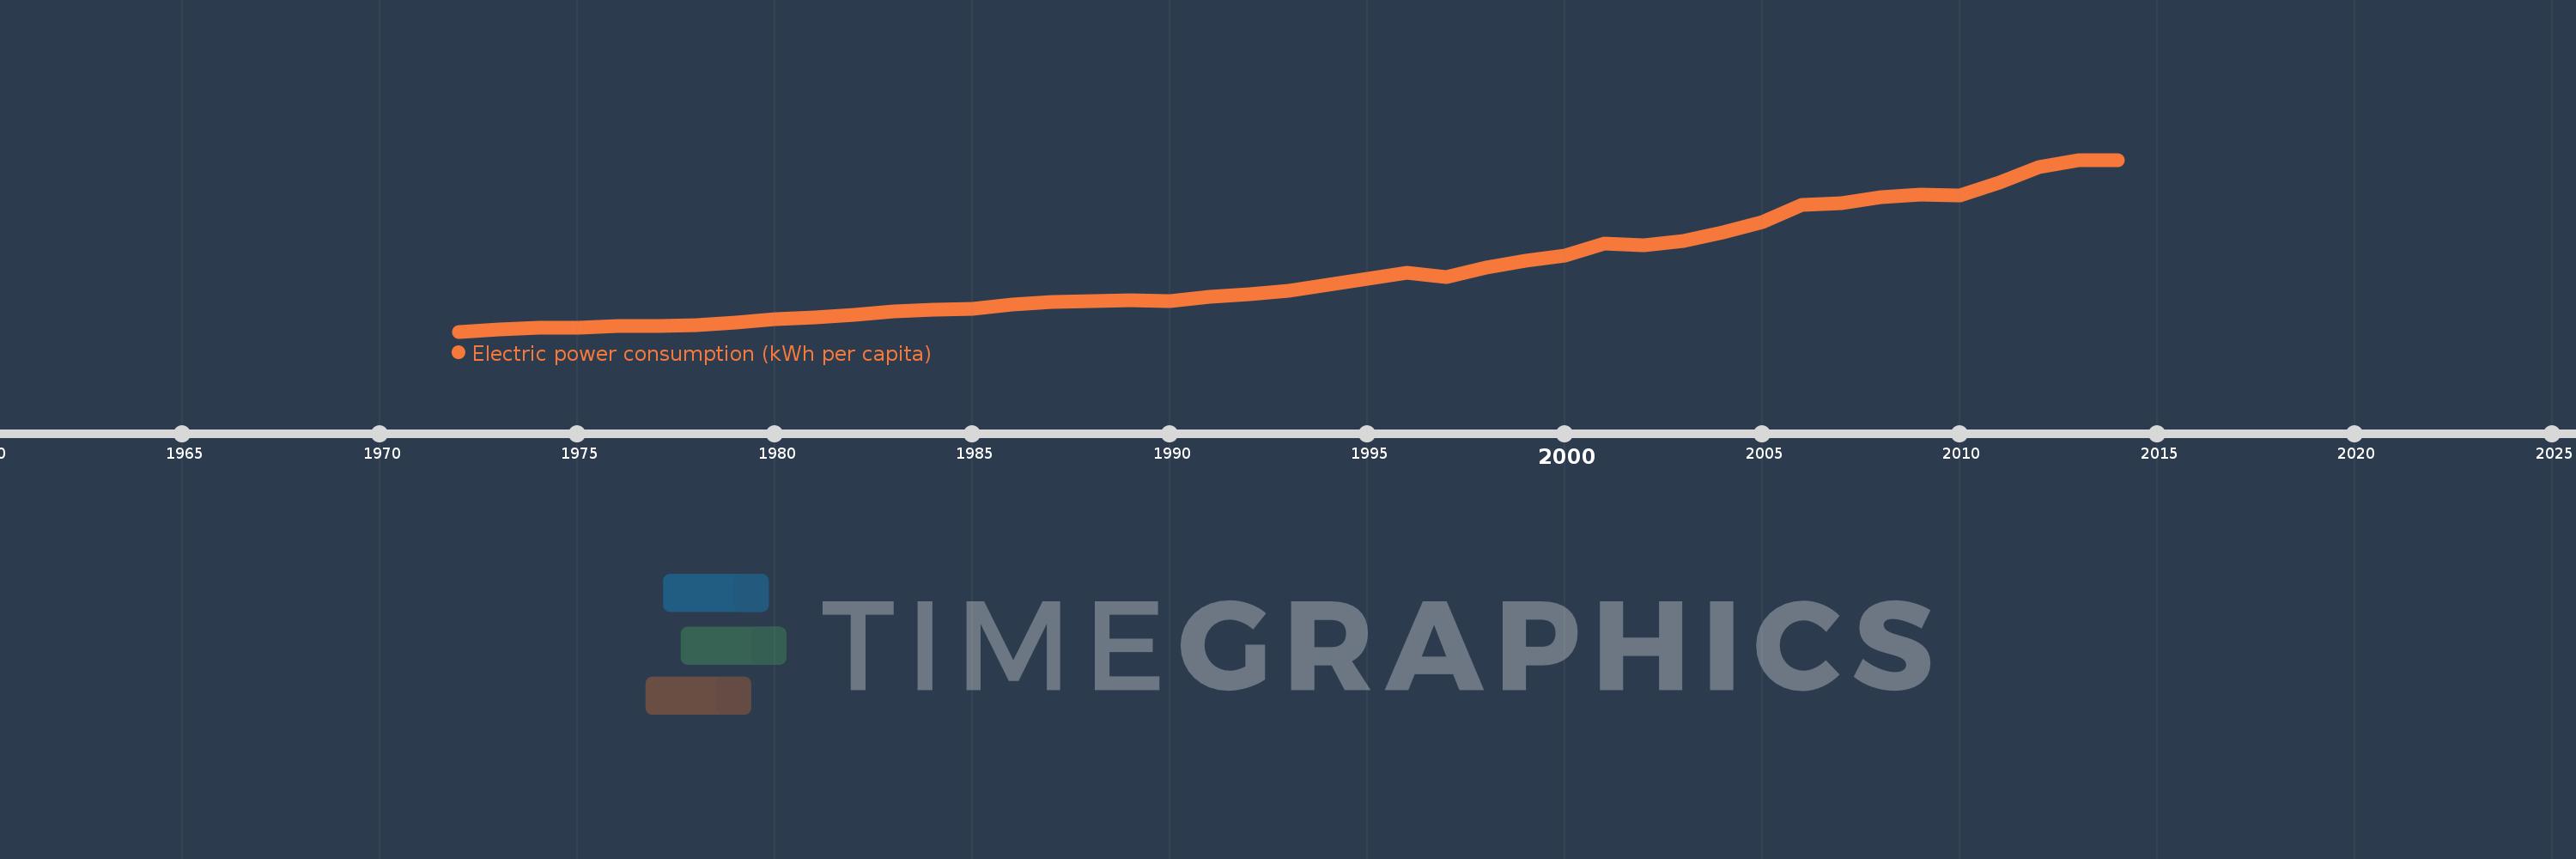
Electric power consumption (kWh per capita)
2014,2013,2012,2011,2010,2009,2008,2007,2006,2005,2004,2003,2002,2001,2000,1999,1998,1997,1996,1995,1994,1993,1992,1991,1990,1989,1988,1987,1986,1985,1984,1983,1982,1981,1980,1979,1978,1977,1976,1975,1974,1973,1972
This statistics in other country:
AlbaniaAlgeriaAngolaArab WorldArgentinaArmeniaAustraliaAustriaAzerbaijanBahrainBangladeshBelarusBelgiumBeninBoliviaBosnia and HerzegovinaBotswanaBrazilBrunei DarussalamBulgariaCambodiaCameroonCanadaCentral Europe and the BalticsChileChinaColombiaCongo, Dem. Rep.Congo, Rep.Costa RicaCote d'IvoireCroatiaCubaCuracaoCyprusCzech RepublicDenmarkDominican RepublicEarly-demographic dividendEast Asia & PacificEast Asia & Pacific (excluding high income)East Asia & Pacific (IDA & IBRD countries)EcuadorEgypt, Arab Rep.El SalvadorEritreaEstoniaEthiopiaEuro areaEurope & Central AsiaEurope & Central Asia (excluding high income)Europe & Central Asia (IDA & IBRD countries)European UnionFinlandFragile and conflict affected situationsFranceGabonGeorgiaGermanyGhanaGibraltarGreeceGuatemalaHaitiHeavily indebted poor countries (HIPC)High incomeHondurasHong Kong SAR, ChinaHungaryIBRD onlyIcelandIDA & IBRD totalIDA blendIDA onlyIDA totalIndiaIndonesiaIran, Islamic Rep.IraqIrelandIsraelItalyJamaicaJapanJordanKazakhstanKenyaKorea, Dem. People’s Rep.Korea, Rep.KosovoKuwaitKyrgyz RepublicLate-demographic dividendLatin America & Caribbean Latin America & Caribbean (excluding high income)Latin America & the Caribbean (IDA & IBRD countries)LatviaLeast developed countries: UN classificationLebanonLibyaLithuaniaLow & middle incomeLower middle incomeLuxembourgMacedonia, FYRMalaysiaMaltaMauritiusMexicoMiddle East & North AfricaMiddle East & North Africa (excluding high income)Middle East & North Africa (IDA & IBRD countries)Middle incomeMoldovaMongoliaMontenegroMoroccoMozambiqueMyanmarNamibiaNepalNetherlandsNew ZealandNicaraguaNigerNigeriaNorth AmericaNorwayOECD membersOmanPakistanPanamaParaguayPeruPhilippinesPolandPortugalPost-demographic dividendPre-demographic dividendQatarRomaniaRussian FederationSaudi ArabiaSenegalSerbiaSingaporeSlovak RepublicSloveniaSouth AfricaSouth AsiaSouth Asia (IDA & IBRD)South SudanSpainSri LankaSub-Saharan Africa Sub-Saharan Africa (excluding high income)Sub-Saharan Africa (IDA & IBRD countries)SudanSwedenSwitzerlandSyrian Arab RepublicTajikistanTanzaniaThailandTogoTrinidad and TobagoTunisiaTurkeyTurkmenistanUkraineUnited Arab EmiratesUnited KingdomUnited StatesUpper middle incomeUruguayUzbekistanVenezuela, RBVietnamWorldYemen, Rep.ZambiaZimbabwe Timeline:
This timeline shows a graph from 1972 to 2014 of Sri Lanka. No data until 1971. Number of actual observations by date: 43.
Source name:
World Development Indicators
Source organization:
IEA Statistics © OECD/IEA 2014 (http://www.iea.org/stats/index.asp), subject to https://www.iea.org/t&c/termsandconditions/
Categories, topics:
Energy & Mining, Climate Change, Infrastructure
Last updated:
apr 23, 2017
Indicators value changes by year
Maximum:
525.876
jan 1, 2014
At the date of observation
Value
Absolute change
Change from previous value
jan 1, 1972
57.92
+57.92
0.0%
jan 1, 1973
64.925
+7.005
12.09%
jan 1, 1974
67.298
+2.373
3.66%
jan 1, 1975
68.127
+0.829
1.23%
jan 1, 1976
72.318
+4.191
6.15%
jan 1, 1977
74.142
+1.824
2.52%
jan 1, 1978
76.316
+2.175
2.93%
jan 1, 1979
83.016
+6.7
8.78%
jan 1, 1980
91.072
+8.056
9.7%
jan 1, 1981
96.63
+5.557
6.1%
jan 1, 1982
103.388
+6.758
6.99%
jan 1, 1983
112.811
+9.423
9.11%
jan 1, 1984
118.065
+5.254
4.66%
jan 1, 1985
121.029
+2.964
2.51%
jan 1, 1986
130.946
+9.916
8.19%
jan 1, 1987
139.464
+8.518
6.51%
jan 1, 1988
139.849
+0.385
0.28%
jan 1, 1989
143.615
+3.765
2.69%
jan 1, 1990
140.55
-3.065
-2.13%
jan 1, 1991
153.648
+13.098
9.32%
jan 1, 1992
159.771
+6.123
3.99%
jan 1, 1993
168.112
+8.341
5.22%
jan 1, 1994
184.567
+16.454
9.79%
jan 1, 1995
201.708
+17.142
9.29%
jan 1, 1996
217.771
+16.063
7.96%
jan 1, 1997
206.26
-11.511
-5.29%
jan 1, 1998
231.676
+25.416
12.32%
jan 1, 1999
251.072
+19.396
8.37%
jan 1, 2000
264.893
+13.821
5.5%
jan 1, 2001
296.757
+31.864
12.03%
jan 1, 2002
292.6
-4.157
-1.4%
jan 1, 2003
305.085
+12.485
4.27%
jan 1, 2004
328.669
+23.585
7.73%
jan 1, 2005
357.31
+28.641
8.71%
jan 1, 2006
403.655
+46.345
12.97%
jan 1, 2007
406.711
+3.056
0.76%
jan 1, 2008
424.039
+17.328
4.26%
jan 1, 2009
429.984
+5.945
1.4%
jan 1, 2010
428.457
-1.527
-0.36%
jan 1, 2011
462.968
+34.512
8.05%
jan 1, 2012
505.328
+42.36
9.15%
jan 1, 2013
524.334
+19.006
3.76%
jan 1, 2014
525.876
+1.542
0.29%
Ranking of countries by current statistics by years


Comments: