29
/
en
AIzaSyAYiBZKx7MnpbEhh9jyipgxe19OcubqV5w
April 1, 2024
258213
Syrian Arab Republic
SYR
true
2
1
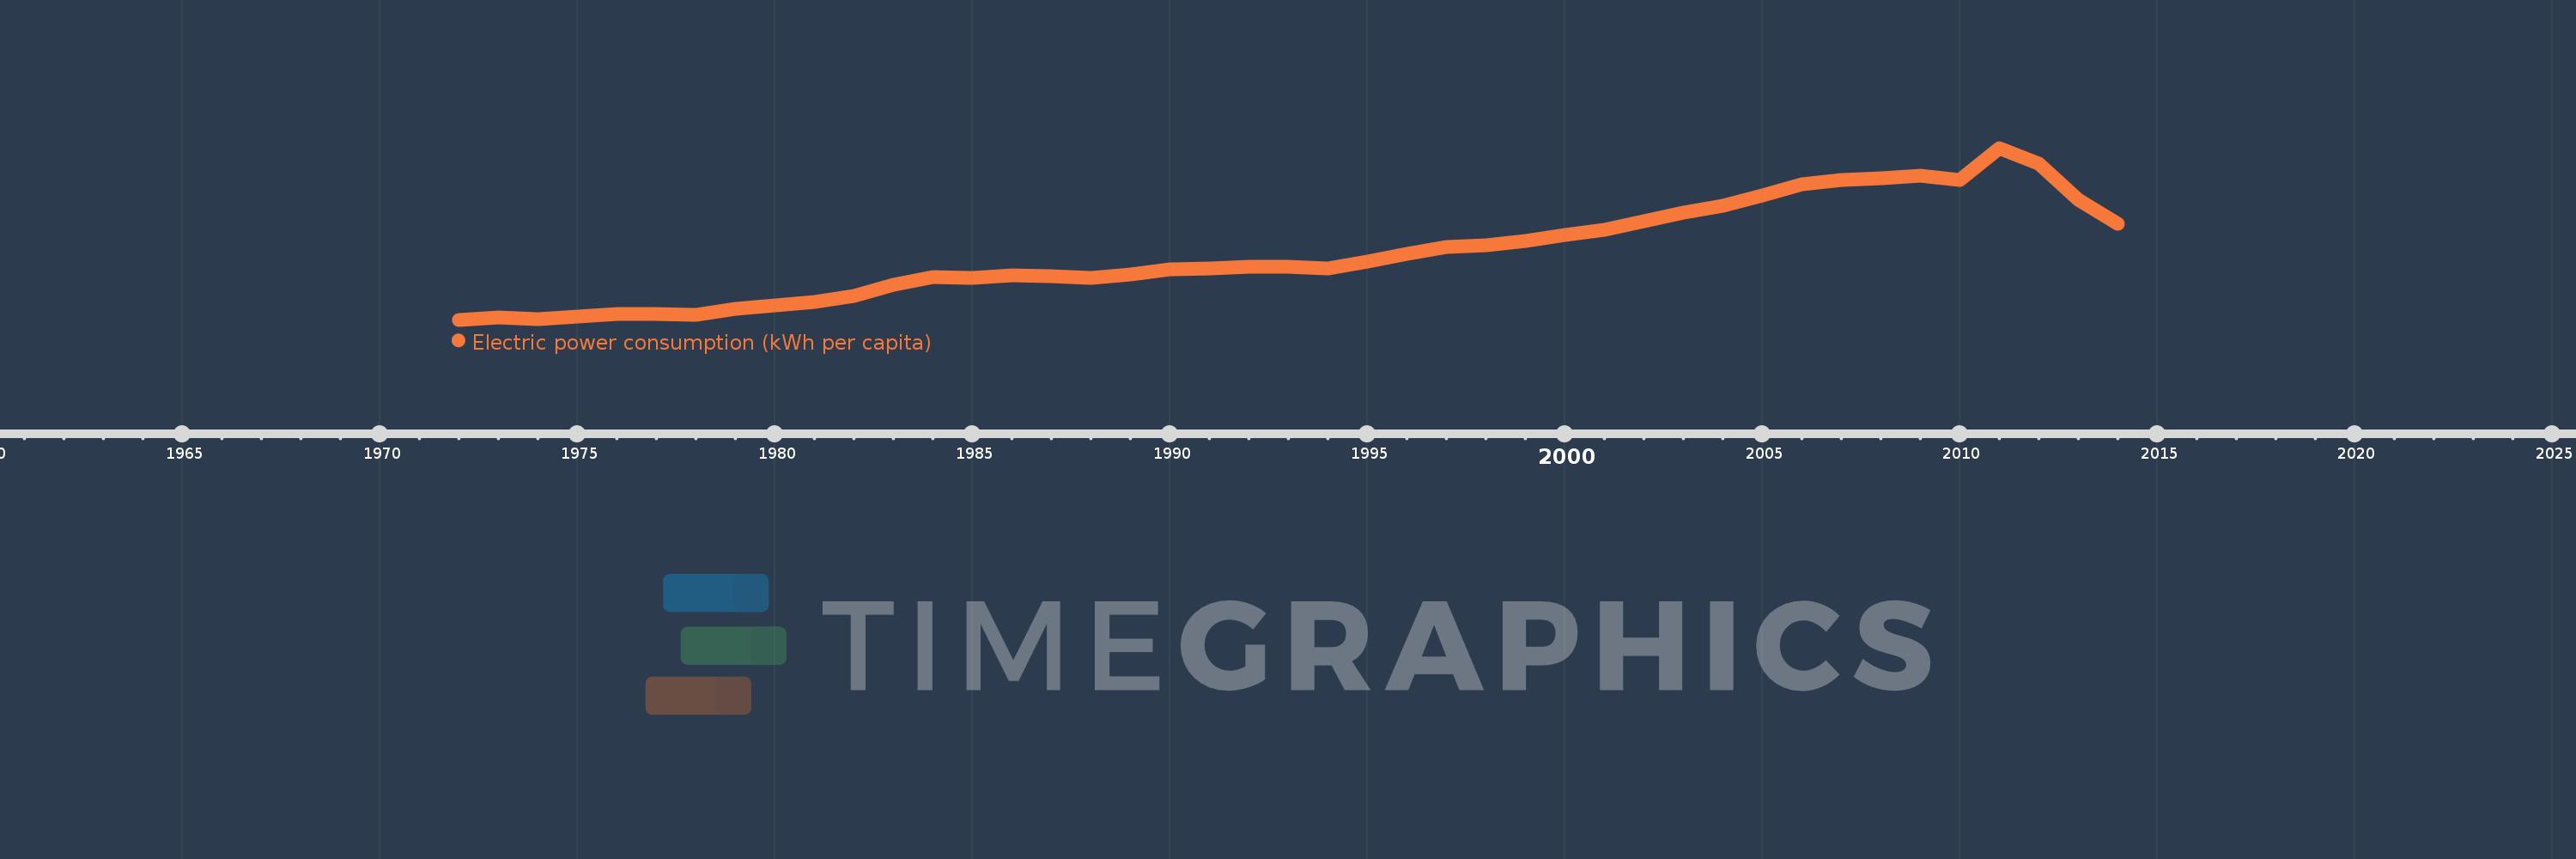
Electric power consumption (kWh per capita)
2014,2013,2012,2011,2010,2009,2008,2007,2006,2005,2004,2003,2002,2001,2000,1999,1998,1997,1996,1995,1994,1993,1992,1991,1990,1989,1988,1987,1986,1985,1984,1983,1982,1981,1980,1979,1978,1977,1976,1975,1974,1973,1972
This statistics in other country:
AlbaniaAlgeriaAngolaArab WorldArgentinaArmeniaAustraliaAustriaAzerbaijanBahrainBangladeshBelarusBelgiumBeninBoliviaBosnia and HerzegovinaBotswanaBrazilBrunei DarussalamBulgariaCambodiaCameroonCanadaCentral Europe and the BalticsChileChinaColombiaCongo, Dem. Rep.Congo, Rep.Costa RicaCote d'IvoireCroatiaCubaCuracaoCyprusCzech RepublicDenmarkDominican RepublicEarly-demographic dividendEast Asia & PacificEast Asia & Pacific (excluding high income)East Asia & Pacific (IDA & IBRD countries)EcuadorEgypt, Arab Rep.El SalvadorEritreaEstoniaEthiopiaEuro areaEurope & Central AsiaEurope & Central Asia (excluding high income)Europe & Central Asia (IDA & IBRD countries)European UnionFinlandFragile and conflict affected situationsFranceGabonGeorgiaGermanyGhanaGibraltarGreeceGuatemalaHaitiHeavily indebted poor countries (HIPC)High incomeHondurasHong Kong SAR, ChinaHungaryIBRD onlyIcelandIDA & IBRD totalIDA blendIDA onlyIDA totalIndiaIndonesiaIran, Islamic Rep.IraqIrelandIsraelItalyJamaicaJapanJordanKazakhstanKenyaKorea, Dem. People’s Rep.Korea, Rep.KosovoKuwaitKyrgyz RepublicLate-demographic dividendLatin America & Caribbean Latin America & Caribbean (excluding high income)Latin America & the Caribbean (IDA & IBRD countries)LatviaLeast developed countries: UN classificationLebanonLibyaLithuaniaLow & middle incomeLower middle incomeLuxembourgMacedonia, FYRMalaysiaMaltaMauritiusMexicoMiddle East & North AfricaMiddle East & North Africa (excluding high income)Middle East & North Africa (IDA & IBRD countries)Middle incomeMoldovaMongoliaMontenegroMoroccoMozambiqueMyanmarNamibiaNepalNetherlandsNew ZealandNicaraguaNigerNigeriaNorth AmericaNorwayOECD membersOmanPakistanPanamaParaguayPeruPhilippinesPolandPortugalPost-demographic dividendPre-demographic dividendQatarRomaniaRussian FederationSaudi ArabiaSenegalSerbiaSingaporeSlovak RepublicSloveniaSouth AfricaSouth AsiaSouth Asia (IDA & IBRD)South SudanSpainSri LankaSub-Saharan Africa Sub-Saharan Africa (excluding high income)Sub-Saharan Africa (IDA & IBRD countries)SudanSwedenSwitzerlandSyrian Arab RepublicTajikistanTanzaniaThailandTogoTrinidad and TobagoTunisiaTurkeyTurkmenistanUkraineUnited Arab EmiratesUnited KingdomUnited StatesUpper middle incomeUruguayUzbekistanVenezuela, RBVietnamWorldYemen, Rep.ZambiaZimbabwe Timeline:
This timeline shows a graph from 1972 to 2014 of Syrian Arab Republic. No data until 1971. Number of actual observations by date: 43.
Source name:
World Development Indicators
Source organization:
IEA Statistics © OECD/IEA 2014 (http://www.iea.org/stats/index.asp), subject to https://www.iea.org/t&c/termsandconditions/
Categories, topics:
Energy & Mining, Climate Change, Infrastructure
Last updated:
apr 23, 2017
Indicators value changes by year
Minimum:
175.471
jan 1, 1972
At the date of observation
Value
Absolute change
Change from previous value
jan 1, 1972
175.471
+175.471
0.0%
jan 1, 1973
200.768
+25.297
14.42%
jan 1, 1974
181.562
-19.207
-9.57%
jan 1, 1975
209.938
+28.376
15.63%
jan 1, 1976
235.59
+25.652
12.22%
jan 1, 1977
228.952
-6.638
-2.82%
jan 1, 1978
222.795
-6.157
-2.69%
jan 1, 1979
287.684
+64.889
29.12%
jan 1, 1980
315.306
+27.622
9.6%
jan 1, 1981
355.51
+40.203
12.75%
jan 1, 1982
412.945
+57.435
16.16%
jan 1, 1983
519.581
+106.636
25.82%
jan 1, 1984
599.147
+79.566
15.31%
jan 1, 1985
588.356
-10.791
-1.8%
jan 1, 1986
617.123
+28.767
4.89%
jan 1, 1987
605.587
-11.536
-1.87%
jan 1, 1988
589.814
-15.773
-2.6%
jan 1, 1989
627.439
+37.625
6.38%
jan 1, 1990
676.581
+49.142
7.83%
jan 1, 1991
688.509
+11.928
1.76%
jan 1, 1992
700.444
+11.935
1.73%
jan 1, 1993
702.402
+1.957
0.28%
jan 1, 1994
687.555
-14.847
-2.11%
jan 1, 1995
751.953
+64.398
9.37%
jan 1, 1996
833.173
+81.219
10.8%
jan 1, 1997
894.26
+61.087
7.33%
jan 1, 1998
915.591
+21.331
2.39%
jan 1, 1999
960.19
+44.599
4.87%
jan 1, 2000
1.016K
+55.498
5.78%
jan 1, 2001
1.069K
+52.916
5.21%
jan 1, 2002
1.149K
+80.523
7.54%
jan 1, 2003
1.24K
+90.76
7.9%
jan 1, 2004
1.303K
+62.619
5.05%
jan 1, 2005
1.41K
+107.359
8.24%
jan 1, 2006
1.517K
+106.886
7.58%
jan 1, 2007
1.565K
+48.322
3.19%
jan 1, 2008
1.576K
+11.146
0.71%
jan 1, 2009
1.603K
+26.752
1.7%
jan 1, 2010
1.562K
-40.604
-2.53%
jan 1, 2011
1.88K
+317.742
20.34%
jan 1, 2012
1.723K
-157.037
-8.35%
jan 1, 2013
1.367K
-355.72
-20.64%
jan 1, 2014
1.127K
-240.796
-17.61%
Ranking of countries by current statistics by years


Comments: