29
/
en
AIzaSyAYiBZKx7MnpbEhh9jyipgxe19OcubqV5w
April 1, 2024
284529
Yemen, Rep.
YEM
true
2
1
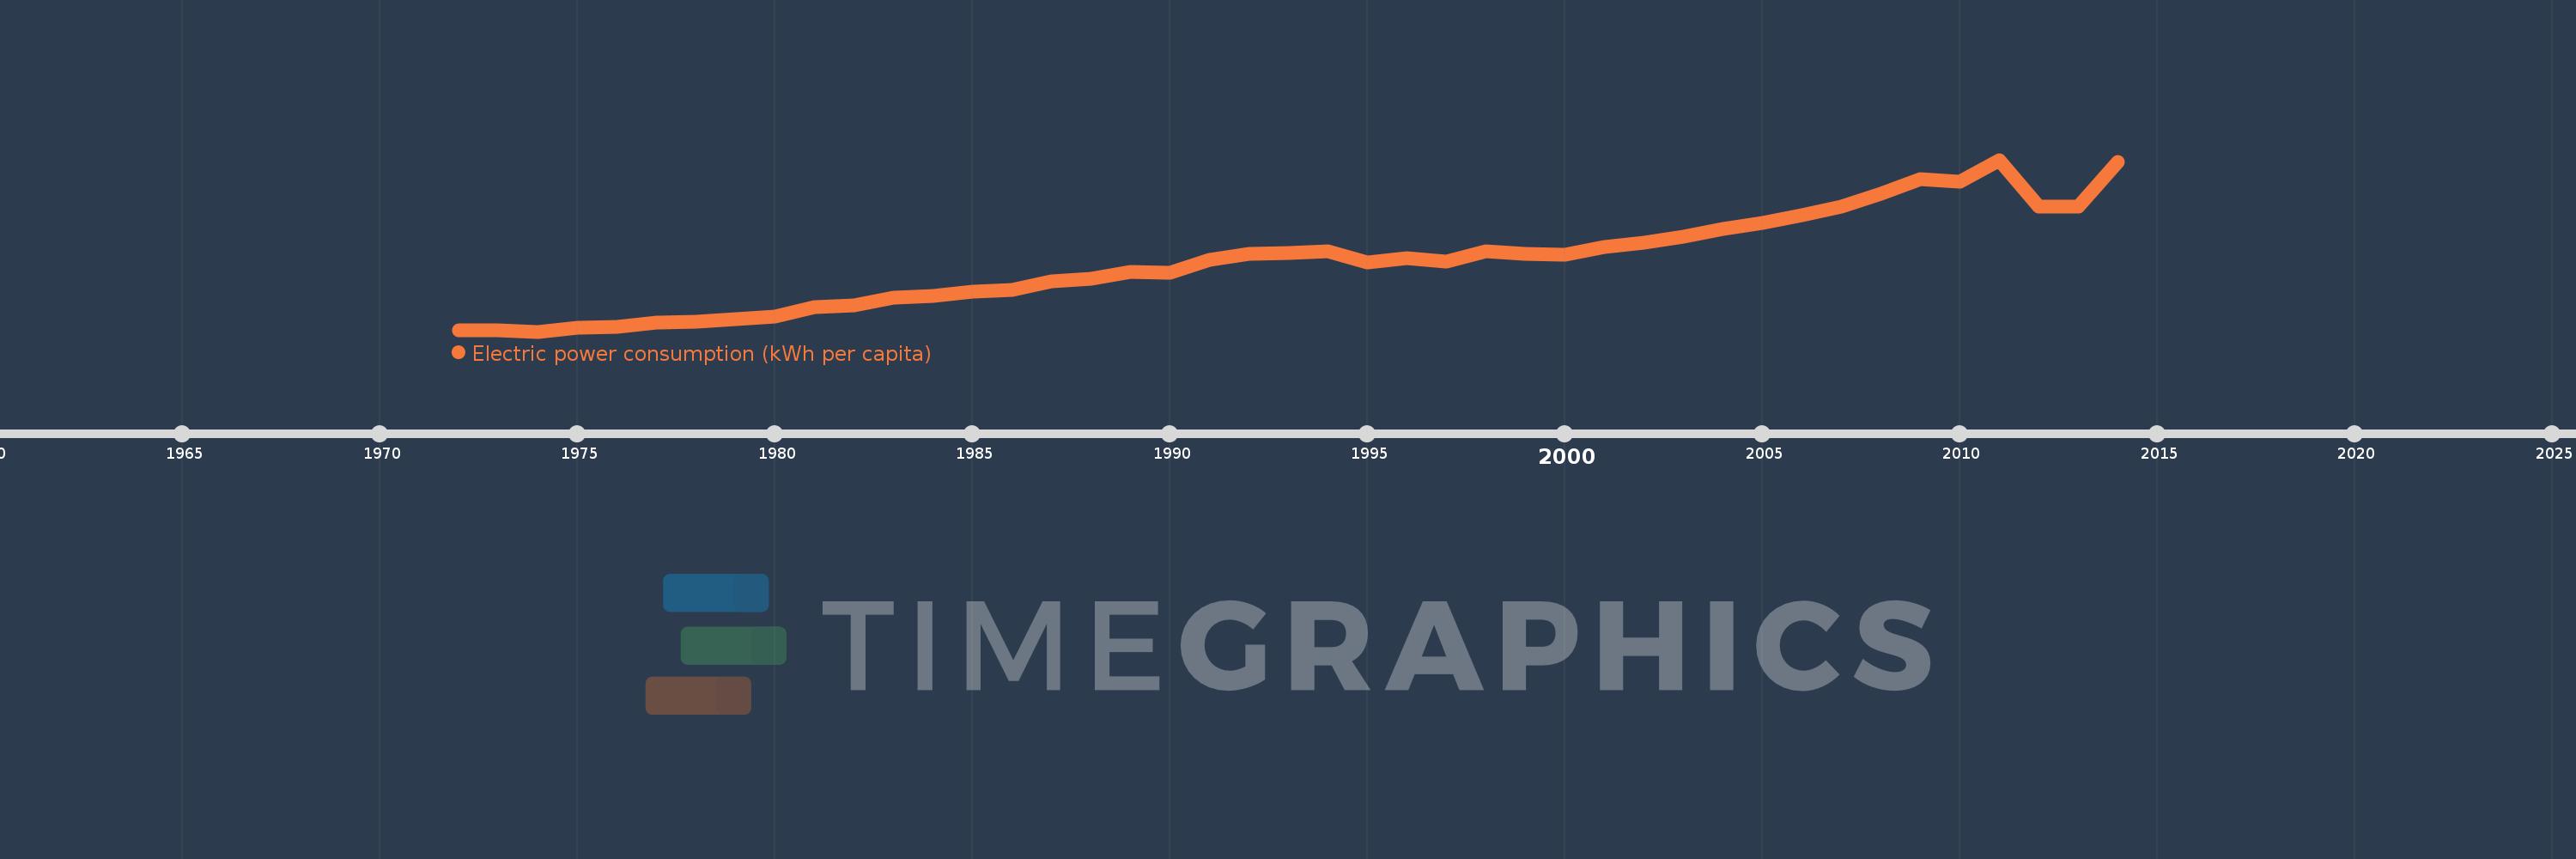
Electric power consumption (kWh per capita)
2014,2013,2012,2011,2010,2009,2008,2007,2006,2005,2004,2003,2002,2001,2000,1999,1998,1997,1996,1995,1994,1993,1992,1991,1990,1989,1988,1987,1986,1985,1984,1983,1982,1981,1980,1979,1978,1977,1976,1975,1974,1973,1972
This statistics in other country:
AlbaniaAlgeriaAngolaArab WorldArgentinaArmeniaAustraliaAustriaAzerbaijanBahrainBangladeshBelarusBelgiumBeninBoliviaBosnia and HerzegovinaBotswanaBrazilBrunei DarussalamBulgariaCambodiaCameroonCanadaCentral Europe and the BalticsChileChinaColombiaCongo, Dem. Rep.Congo, Rep.Costa RicaCote d'IvoireCroatiaCubaCuracaoCyprusCzech RepublicDenmarkDominican RepublicEarly-demographic dividendEast Asia & PacificEast Asia & Pacific (excluding high income)East Asia & Pacific (IDA & IBRD countries)EcuadorEgypt, Arab Rep.El SalvadorEritreaEstoniaEthiopiaEuro areaEurope & Central AsiaEurope & Central Asia (excluding high income)Europe & Central Asia (IDA & IBRD countries)European UnionFinlandFragile and conflict affected situationsFranceGabonGeorgiaGermanyGhanaGibraltarGreeceGuatemalaHaitiHeavily indebted poor countries (HIPC)High incomeHondurasHong Kong SAR, ChinaHungaryIBRD onlyIcelandIDA & IBRD totalIDA blendIDA onlyIDA totalIndiaIndonesiaIran, Islamic Rep.IraqIrelandIsraelItalyJamaicaJapanJordanKazakhstanKenyaKorea, Dem. People’s Rep.Korea, Rep.KosovoKuwaitKyrgyz RepublicLate-demographic dividendLatin America & Caribbean Latin America & Caribbean (excluding high income)Latin America & the Caribbean (IDA & IBRD countries)LatviaLeast developed countries: UN classificationLebanonLibyaLithuaniaLow & middle incomeLower middle incomeLuxembourgMacedonia, FYRMalaysiaMaltaMauritiusMexicoMiddle East & North AfricaMiddle East & North Africa (excluding high income)Middle East & North Africa (IDA & IBRD countries)Middle incomeMoldovaMongoliaMontenegroMoroccoMozambiqueMyanmarNamibiaNepalNetherlandsNew ZealandNicaraguaNigerNigeriaNorth AmericaNorwayOECD membersOmanPakistanPanamaParaguayPeruPhilippinesPolandPortugalPost-demographic dividendPre-demographic dividendQatarRomaniaRussian FederationSaudi ArabiaSenegalSerbiaSingaporeSlovak RepublicSloveniaSouth AfricaSouth AsiaSouth Asia (IDA & IBRD)South SudanSpainSri LankaSub-Saharan Africa Sub-Saharan Africa (excluding high income)Sub-Saharan Africa (IDA & IBRD countries)SudanSwedenSwitzerlandSyrian Arab RepublicTajikistanTanzaniaThailandTogoTrinidad and TobagoTunisiaTurkeyTurkmenistanUkraineUnited Arab EmiratesUnited KingdomUnited StatesUpper middle incomeUruguayUzbekistanVenezuela, RBVietnamWorldYemen, Rep.ZambiaZimbabwe Timeline:
This timeline shows a graph from 1972 to 2014 of Yemen, Rep.. No data until 1971. Number of actual observations by date: 43.
Source name:
World Development Indicators
Source organization:
IEA Statistics © OECD/IEA 2014 (http://www.iea.org/stats/index.asp), subject to https://www.iea.org/t&c/termsandconditions/
Categories, topics:
Energy & Mining, Climate Change, Infrastructure
Last updated:
apr 23, 2017
Indicators value changes by year
Minimum:
31.752
jan 1, 1974
Maximum:
250.127
jan 1, 2011
At the date of observation
Value
Absolute change
Change from previous value
jan 1, 1972
33.371
+33.371
0.0%
jan 1, 1973
33.749
+0.378
1.13%
jan 1, 1974
31.752
-1.997
-5.92%
jan 1, 1975
36.22
+4.468
14.07%
jan 1, 1976
37.828
+1.608
4.44%
jan 1, 1977
43.032
+5.204
13.76%
jan 1, 1978
43.864
+0.832
1.93%
jan 1, 1979
48.09
+4.226
9.63%
jan 1, 1980
50.74
+2.65
5.51%
jan 1, 1981
62.412
+11.672
23.0%
jan 1, 1982
64.877
+2.465
3.95%
jan 1, 1983
75.302
+10.425
16.07%
jan 1, 1984
76.632
+1.33
1.77%
jan 1, 1985
82.535
+5.903
7.7%
jan 1, 1986
84.201
+1.666
2.02%
jan 1, 1987
95.729
+11.529
13.69%
jan 1, 1988
98.742
+3.013
3.15%
jan 1, 1989
108.13
+9.388
9.51%
jan 1, 1990
106.065
-2.065
-1.91%
jan 1, 1991
122.982
+16.917
15.95%
jan 1, 1992
130.457
+7.474
6.08%
jan 1, 1993
131.295
+0.838
0.64%
jan 1, 1994
133.495
+2.2
1.68%
jan 1, 1995
119.66
-13.834
-10.36%
jan 1, 1996
125.048
+5.388
4.5%
jan 1, 1997
120.558
-4.49
-3.59%
jan 1, 1998
133.885
+13.328
11.06%
jan 1, 1999
130.838
-3.047
-2.28%
jan 1, 2000
129.389
-1.449
-1.11%
jan 1, 2001
139.644
+10.255
7.93%
jan 1, 2002
144.267
+4.623
3.31%
jan 1, 2003
152.081
+7.813
5.42%
jan 1, 2004
162.331
+10.25
6.74%
jan 1, 2005
169.981
+7.65
4.71%
jan 1, 2006
180.108
+10.127
5.96%
jan 1, 2007
190.149
+10.041
5.58%
jan 1, 2008
207.132
+16.983
8.93%
jan 1, 2009
225.69
+18.557
8.96%
jan 1, 2010
222.661
-3.029
-1.34%
jan 1, 2011
250.127
+27.467
12.34%
jan 1, 2012
190.386
-59.741
-23.88%
jan 1, 2013
190.614
+0.227
0.12%
jan 1, 2014
247.168
+56.555
29.67%
Ranking of countries by current statistics by years


Comments: