29
/
en
AIzaSyAYiBZKx7MnpbEhh9jyipgxe19OcubqV5w
April 1, 2024
47027
Lower middle income
LMC
false
2
1
Electric power consumption (kWh per capita)
2014,2013,2012,2011,2010,2009,2008,2007,2006,2005,2004,2003,2002,2001,2000,1999,1998,1997,1996,1995,1994,1993,1992,1991,1990,1989,1988,1987,1986,1985,1984,1983,1982,1981,1980,1979,1978,1977,1976,1975,1974,1973,1972
This statistics in other country:
AlbaniaAlgeriaAngolaArab WorldArgentinaArmeniaAustraliaAustriaAzerbaijanBahrainBangladeshBelarusBelgiumBeninBoliviaBosnia and HerzegovinaBotswanaBrazilBrunei DarussalamBulgariaCambodiaCameroonCanadaCentral Europe and the BalticsChileChinaColombiaCongo, Dem. Rep.Congo, Rep.Costa RicaCote d'IvoireCroatiaCubaCuracaoCyprusCzech RepublicDenmarkDominican RepublicEarly-demographic dividendEast Asia & PacificEast Asia & Pacific (excluding high income)East Asia & Pacific (IDA & IBRD countries)EcuadorEgypt, Arab Rep.El SalvadorEritreaEstoniaEthiopiaEuro areaEurope & Central AsiaEurope & Central Asia (excluding high income)Europe & Central Asia (IDA & IBRD countries)European UnionFinlandFragile and conflict affected situationsFranceGabonGeorgiaGermanyGhanaGibraltarGreeceGuatemalaHaitiHeavily indebted poor countries (HIPC)High incomeHondurasHong Kong SAR, ChinaHungaryIBRD onlyIcelandIDA & IBRD totalIDA blendIDA onlyIDA totalIndiaIndonesiaIran, Islamic Rep.IraqIrelandIsraelItalyJamaicaJapanJordanKazakhstanKenyaKorea, Dem. People’s Rep.Korea, Rep.KosovoKuwaitKyrgyz RepublicLate-demographic dividendLatin America & Caribbean Latin America & Caribbean (excluding high income)Latin America & the Caribbean (IDA & IBRD countries)LatviaLeast developed countries: UN classificationLebanonLibyaLithuaniaLow & middle incomeLower middle incomeLuxembourgMacedonia, FYRMalaysiaMaltaMauritiusMexicoMiddle East & North AfricaMiddle East & North Africa (excluding high income)Middle East & North Africa (IDA & IBRD countries)Middle incomeMoldovaMongoliaMontenegroMoroccoMozambiqueMyanmarNamibiaNepalNetherlandsNew ZealandNicaraguaNigerNigeriaNorth AmericaNorwayOECD membersOmanPakistanPanamaParaguayPeruPhilippinesPolandPortugalPost-demographic dividendPre-demographic dividendQatarRomaniaRussian FederationSaudi ArabiaSenegalSerbiaSingaporeSlovak RepublicSloveniaSouth AfricaSouth AsiaSouth Asia (IDA & IBRD)South SudanSpainSri LankaSub-Saharan Africa Sub-Saharan Africa (excluding high income)Sub-Saharan Africa (IDA & IBRD countries)SudanSwedenSwitzerlandSyrian Arab RepublicTajikistanTanzaniaThailandTogoTrinidad and TobagoTunisiaTurkeyTurkmenistanUkraineUnited Arab EmiratesUnited KingdomUnited StatesUpper middle incomeUruguayUzbekistanVenezuela, RBVietnamWorldYemen, Rep.ZambiaZimbabwe Timeline:
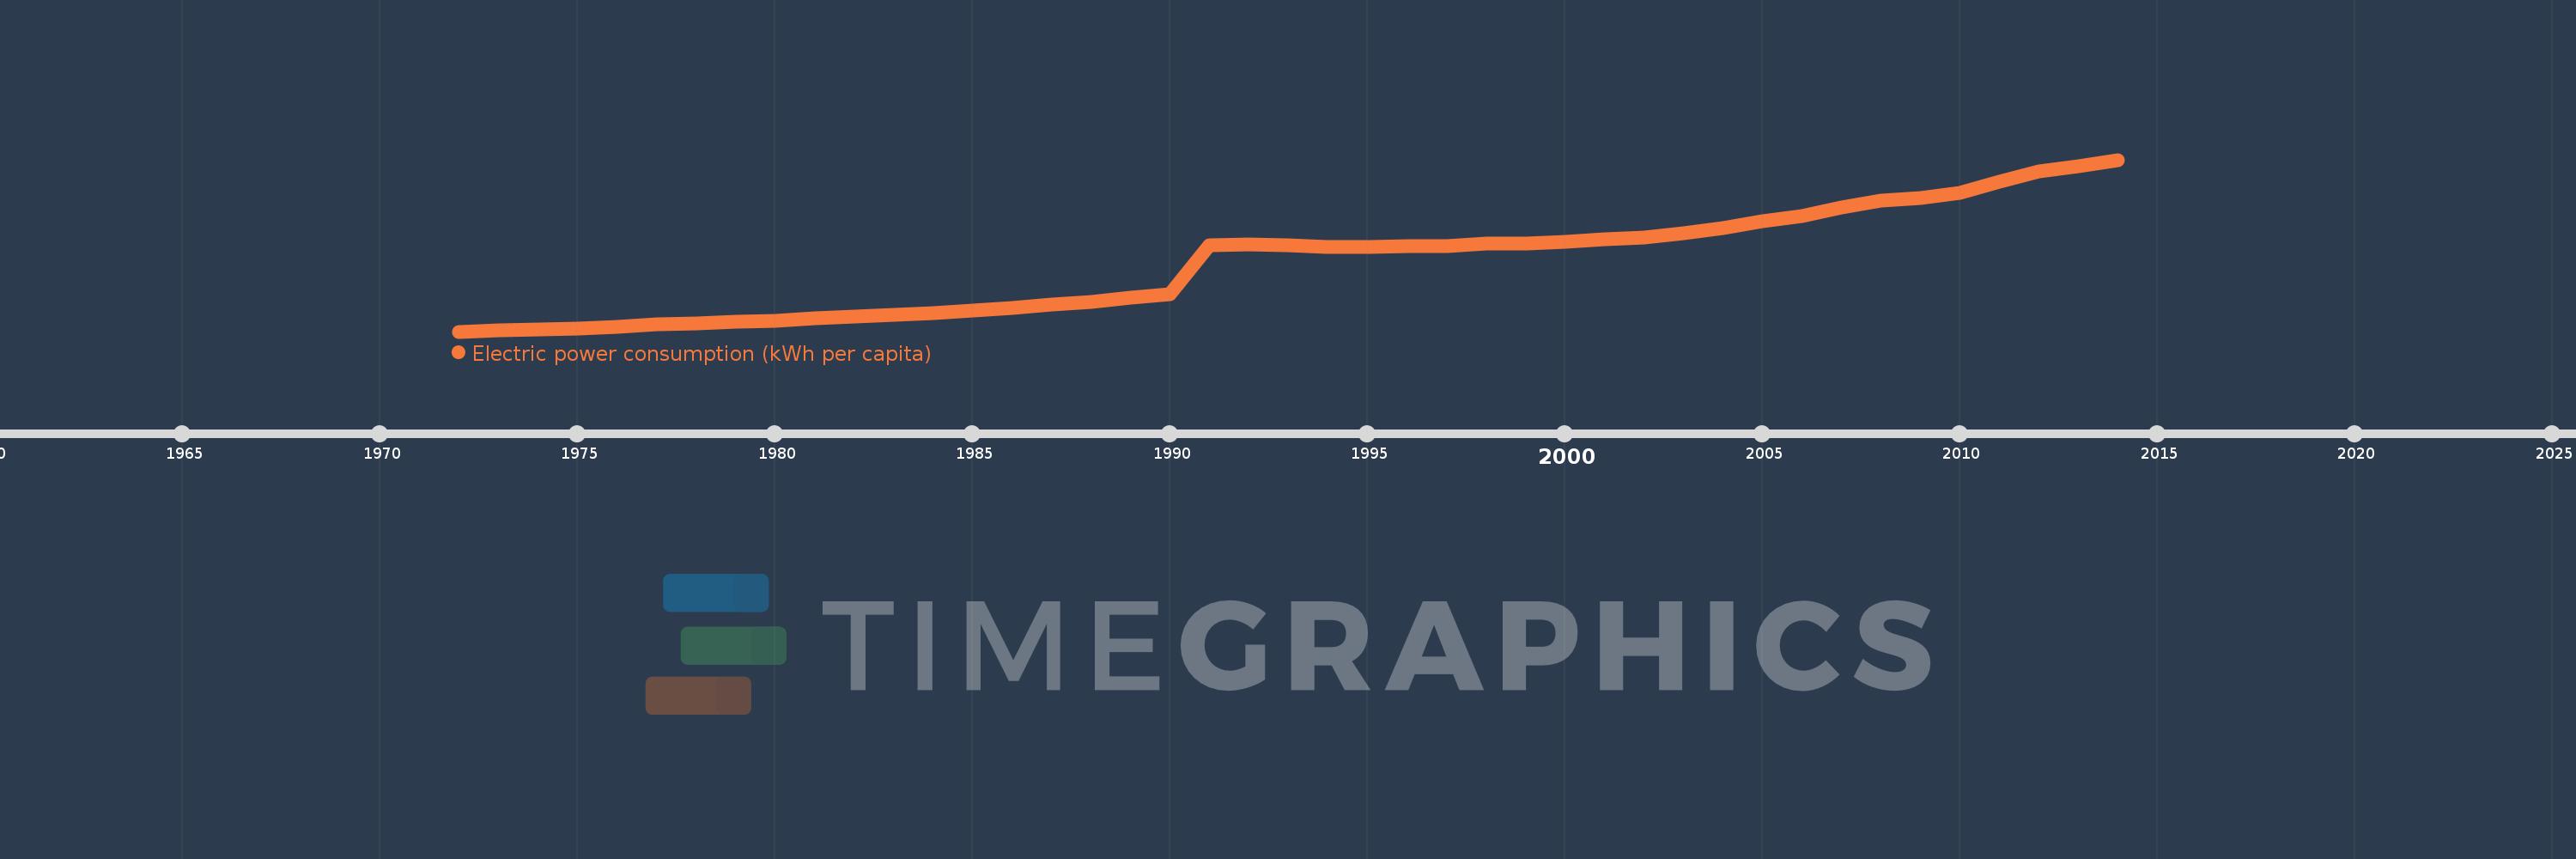
This timeline shows a graph from 1972 to 2014 of Lower middle income. No data until 1971. Number of actual observations by date: 43.
Source name:
World Development Indicators
Source organization:
IEA Statistics © OECD/IEA 2014 (http://www.iea.org/stats/index.asp), subject to https://www.iea.org/t&c/termsandconditions/
Categories, topics:
Energy & Mining, Climate Change, Infrastructure
Last updated:
apr 23, 2017
Indicators value changes by year
Minimum:
89.857
jan 1, 1972
Maximum:
744.596
jan 1, 2014
At the date of observation
Value
Absolute change
Change from previous value
jan 1, 1972
89.857
+89.857
0.0%
jan 1, 1973
93.364
+3.508
3.9%
jan 1, 1974
97.534
+4.17
4.47%
jan 1, 1975
100.876
+3.341
3.43%
jan 1, 1976
108.9
+8.025
7.95%
jan 1, 1977
116.42
+7.519
6.9%
jan 1, 1978
120.268
+3.849
3.31%
jan 1, 1979
127.888
+7.62
6.34%
jan 1, 1980
132.191
+4.302
3.36%
jan 1, 1981
139.257
+7.066
5.35%
jan 1, 1982
145.773
+6.516
4.68%
jan 1, 1983
154.388
+8.615
5.91%
jan 1, 1984
160.946
+6.558
4.25%
jan 1, 1985
169.73
+8.785
5.46%
jan 1, 1986
180.499
+10.769
6.34%
jan 1, 1987
193.239
+12.74
7.06%
jan 1, 1988
203.709
+10.47
5.42%
jan 1, 1989
219.429
+15.719
7.72%
jan 1, 1990
232.606
+13.177
6.01%
jan 1, 1991
417.774
+185.168
79.61%
jan 1, 1992
422.53
+4.755
1.14%
jan 1, 1993
417.537
-4.993
-1.18%
jan 1, 1994
411.647
-5.89
-1.41%
jan 1, 1995
410.813
-0.834
-0.2%
jan 1, 1996
417.203
+6.39
1.56%
jan 1, 1997
415.24
-1.963
-0.47%
jan 1, 1998
424.712
+9.472
2.28%
jan 1, 1999
426.282
+1.57
0.37%
jan 1, 2000
433.354
+7.071
1.66%
jan 1, 2001
441.783
+8.43
1.95%
jan 1, 2002
448.07
+6.287
1.42%
jan 1, 2003
463.155
+15.085
3.37%
jan 1, 2004
483.843
+20.688
4.47%
jan 1, 2005
509.233
+25.389
5.25%
jan 1, 2006
529.72
+20.488
4.02%
jan 1, 2007
561.727
+32.007
6.04%
jan 1, 2008
588.382
+26.654
4.75%
jan 1, 2009
599.801
+11.42
1.94%
jan 1, 2010
619.838
+20.037
3.34%
jan 1, 2011
662.013
+42.175
6.8%
jan 1, 2012
699.566
+37.552
5.67%
jan 1, 2013
718.837
+19.272
2.75%
jan 1, 2014
744.596
+25.759
3.58%
Ranking of countries by current statistics by years


Comments: