29
/
en
AIzaSyAYiBZKx7MnpbEhh9jyipgxe19OcubqV5w
April 1, 2024
65875
Algeria
DZA
true
2
1
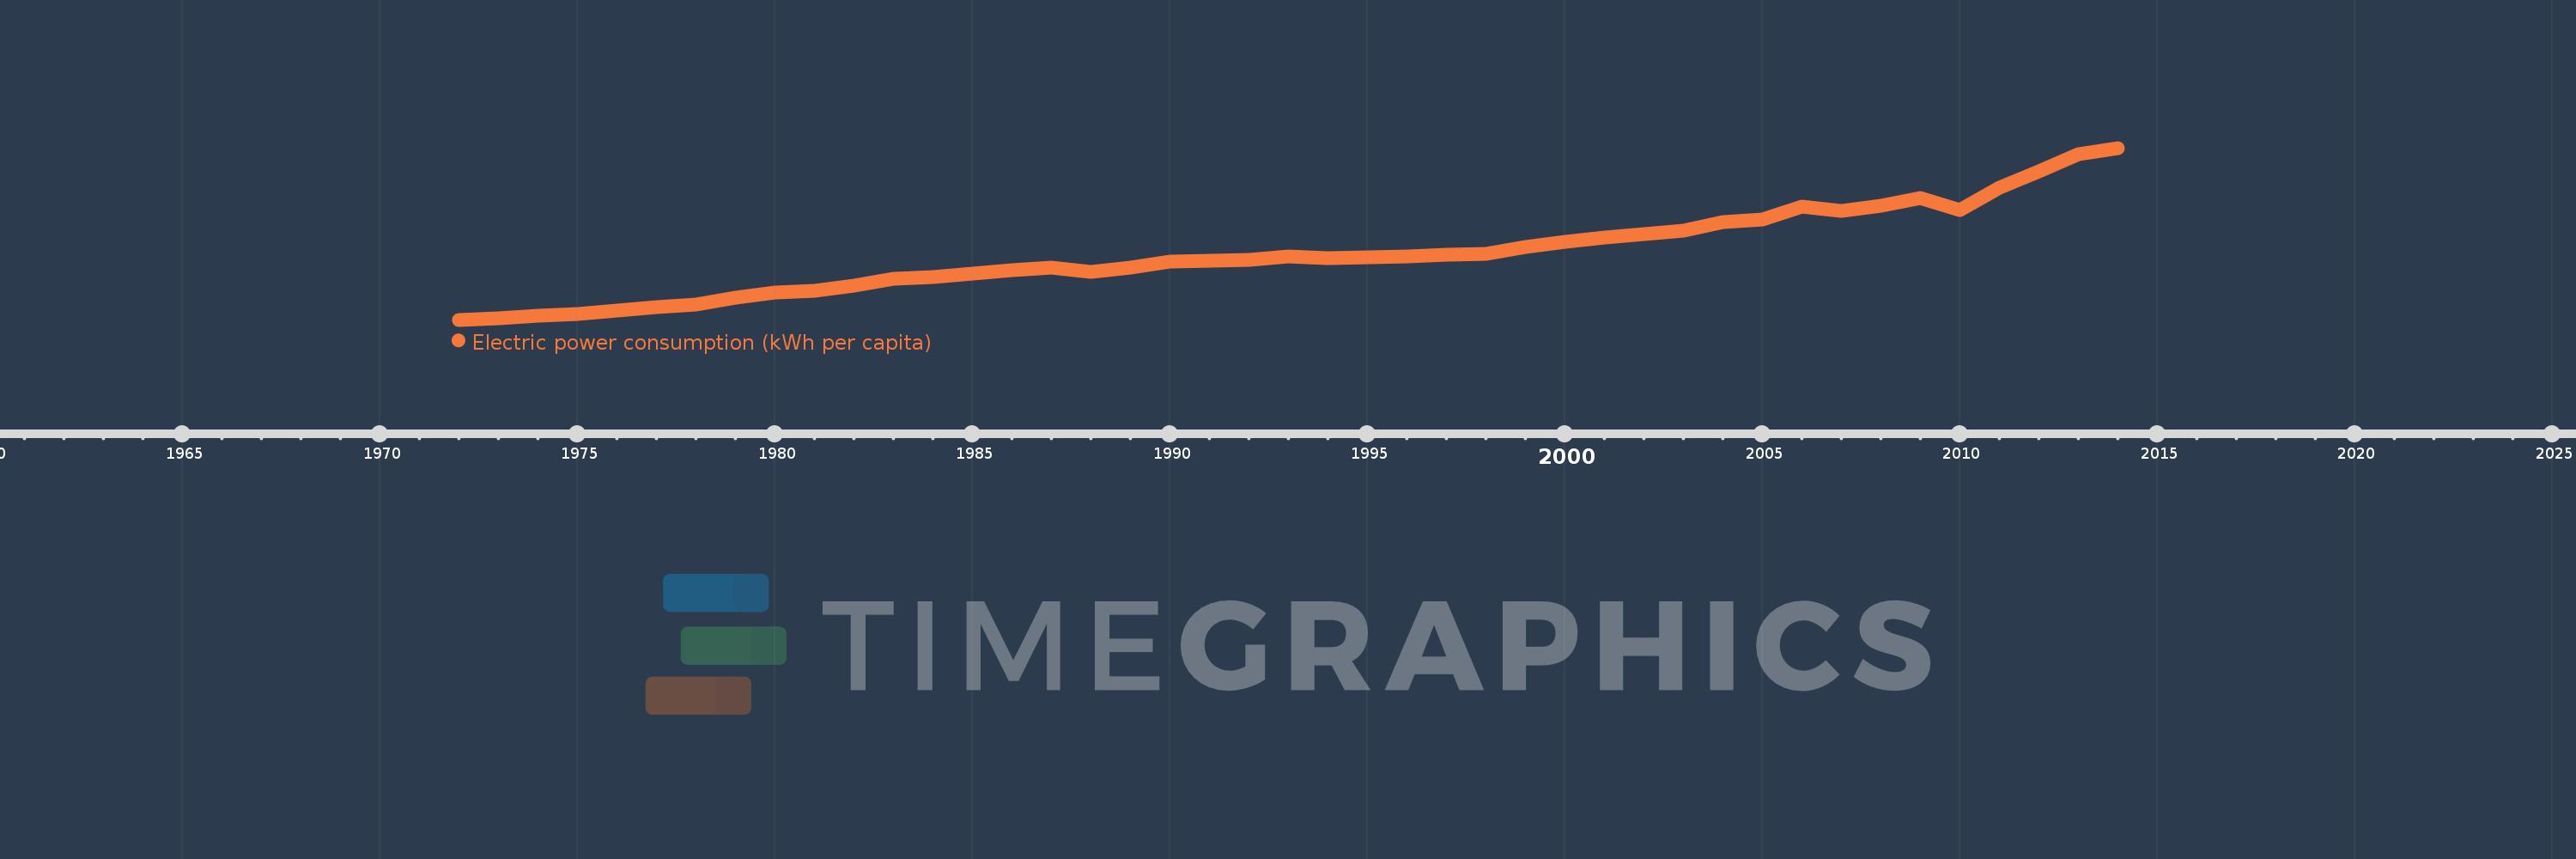
Electric power consumption (kWh per capita)
2014,2013,2012,2011,2010,2009,2008,2007,2006,2005,2004,2003,2002,2001,2000,1999,1998,1997,1996,1995,1994,1993,1992,1991,1990,1989,1988,1987,1986,1985,1984,1983,1982,1981,1980,1979,1978,1977,1976,1975,1974,1973,1972
This statistics in other country:
AlbaniaAlgeriaAngolaArab WorldArgentinaArmeniaAustraliaAustriaAzerbaijanBahrainBangladeshBelarusBelgiumBeninBoliviaBosnia and HerzegovinaBotswanaBrazilBrunei DarussalamBulgariaCambodiaCameroonCanadaCentral Europe and the BalticsChileChinaColombiaCongo, Dem. Rep.Congo, Rep.Costa RicaCote d'IvoireCroatiaCubaCuracaoCyprusCzech RepublicDenmarkDominican RepublicEarly-demographic dividendEast Asia & PacificEast Asia & Pacific (excluding high income)East Asia & Pacific (IDA & IBRD countries)EcuadorEgypt, Arab Rep.El SalvadorEritreaEstoniaEthiopiaEuro areaEurope & Central AsiaEurope & Central Asia (excluding high income)Europe & Central Asia (IDA & IBRD countries)European UnionFinlandFragile and conflict affected situationsFranceGabonGeorgiaGermanyGhanaGibraltarGreeceGuatemalaHaitiHeavily indebted poor countries (HIPC)High incomeHondurasHong Kong SAR, ChinaHungaryIBRD onlyIcelandIDA & IBRD totalIDA blendIDA onlyIDA totalIndiaIndonesiaIran, Islamic Rep.IraqIrelandIsraelItalyJamaicaJapanJordanKazakhstanKenyaKorea, Dem. People’s Rep.Korea, Rep.KosovoKuwaitKyrgyz RepublicLate-demographic dividendLatin America & Caribbean Latin America & Caribbean (excluding high income)Latin America & the Caribbean (IDA & IBRD countries)LatviaLeast developed countries: UN classificationLebanonLibyaLithuaniaLow & middle incomeLower middle incomeLuxembourgMacedonia, FYRMalaysiaMaltaMauritiusMexicoMiddle East & North AfricaMiddle East & North Africa (excluding high income)Middle East & North Africa (IDA & IBRD countries)Middle incomeMoldovaMongoliaMontenegroMoroccoMozambiqueMyanmarNamibiaNepalNetherlandsNew ZealandNicaraguaNigerNigeriaNorth AmericaNorwayOECD membersOmanPakistanPanamaParaguayPeruPhilippinesPolandPortugalPost-demographic dividendPre-demographic dividendQatarRomaniaRussian FederationSaudi ArabiaSenegalSerbiaSingaporeSlovak RepublicSloveniaSouth AfricaSouth AsiaSouth Asia (IDA & IBRD)South SudanSpainSri LankaSub-Saharan Africa Sub-Saharan Africa (excluding high income)Sub-Saharan Africa (IDA & IBRD countries)SudanSwedenSwitzerlandSyrian Arab RepublicTajikistanTanzaniaThailandTogoTrinidad and TobagoTunisiaTurkeyTurkmenistanUkraineUnited Arab EmiratesUnited KingdomUnited StatesUpper middle incomeUruguayUzbekistanVenezuela, RBVietnamWorldYemen, Rep.ZambiaZimbabwe Timeline:
This timeline shows a graph from 1972 to 2014 of Algeria. No data until 1971. Number of actual observations by date: 43.
Source name:
World Development Indicators
Source organization:
IEA Statistics © OECD/IEA 2014 (http://www.iea.org/stats/index.asp), subject to https://www.iea.org/t&c/termsandconditions/
Categories, topics:
Energy & Mining, Climate Change, Infrastructure
Last updated:
apr 23, 2017
Indicators value changes by year
Minimum:
133.087
jan 1, 1972
Maximum:
1.277K
jan 1, 2014
At the date of observation
Value
Absolute change
Change from previous value
jan 1, 1972
133.087
+133.087
0.0%
jan 1, 1973
142.029
+8.942
6.72%
jan 1, 1974
157.804
+15.774
11.11%
jan 1, 1975
169.63
+11.826
7.49%
jan 1, 1976
194.505
+24.875
14.66%
jan 1, 1977
218.729
+24.224
12.45%
jan 1, 1978
231.71
+12.982
5.94%
jan 1, 1979
277.285
+45.574
19.67%
jan 1, 1980
312.674
+35.389
12.76%
jan 1, 1981
328.322
+15.648
5.0%
jan 1, 1982
361.268
+32.946
10.03%
jan 1, 1983
403.631
+42.364
11.73%
jan 1, 1984
415.012
+11.381
2.82%
jan 1, 1985
438.662
+23.65
5.7%
jan 1, 1986
463.708
+25.046
5.71%
jan 1, 1987
482.375
+18.666
4.03%
jan 1, 1988
452.674
-29.701
-6.16%
jan 1, 1989
478.987
+26.313
5.81%
jan 1, 1990
519.011
+40.024
8.36%
jan 1, 1991
528.435
+9.424
1.82%
jan 1, 1992
529.406
+0.971
0.18%
jan 1, 1993
556.64
+27.234
5.14%
jan 1, 1994
545.023
-11.617
-2.09%
jan 1, 1995
548.092
+3.069
0.56%
jan 1, 1996
557.08
+8.988
1.64%
jan 1, 1997
567.697
+10.617
1.91%
jan 1, 1998
572.911
+5.214
0.92%
jan 1, 1999
615.554
+42.643
7.44%
jan 1, 2000
649.764
+34.21
5.56%
jan 1, 2001
680.196
+30.432
4.68%
jan 1, 2002
705.976
+25.78
3.79%
jan 1, 2003
727.719
+21.743
3.08%
jan 1, 2004
783.241
+55.522
7.63%
jan 1, 2005
801.043
+17.802
2.27%
jan 1, 2006
887.462
+86.42
10.79%
jan 1, 2007
859.662
-27.801
-3.13%
jan 1, 2008
891.805
+32.144
3.74%
jan 1, 2009
945.102
+53.297
5.98%
jan 1, 2010
864.646
-80.456
-8.51%
jan 1, 2011
1.015K
+150.335
17.39%
jan 1, 2012
1.122K
+106.648
10.51%
jan 1, 2013
1.236K
+114.501
10.21%
jan 1, 2014
1.277K
+41.245
3.34%
Ranking of countries by current statistics by years


Comments: