29
/
en
AIzaSyAYiBZKx7MnpbEhh9jyipgxe19OcubqV5w
April 1, 2024
201441
Morocco
MAR
true
2
1
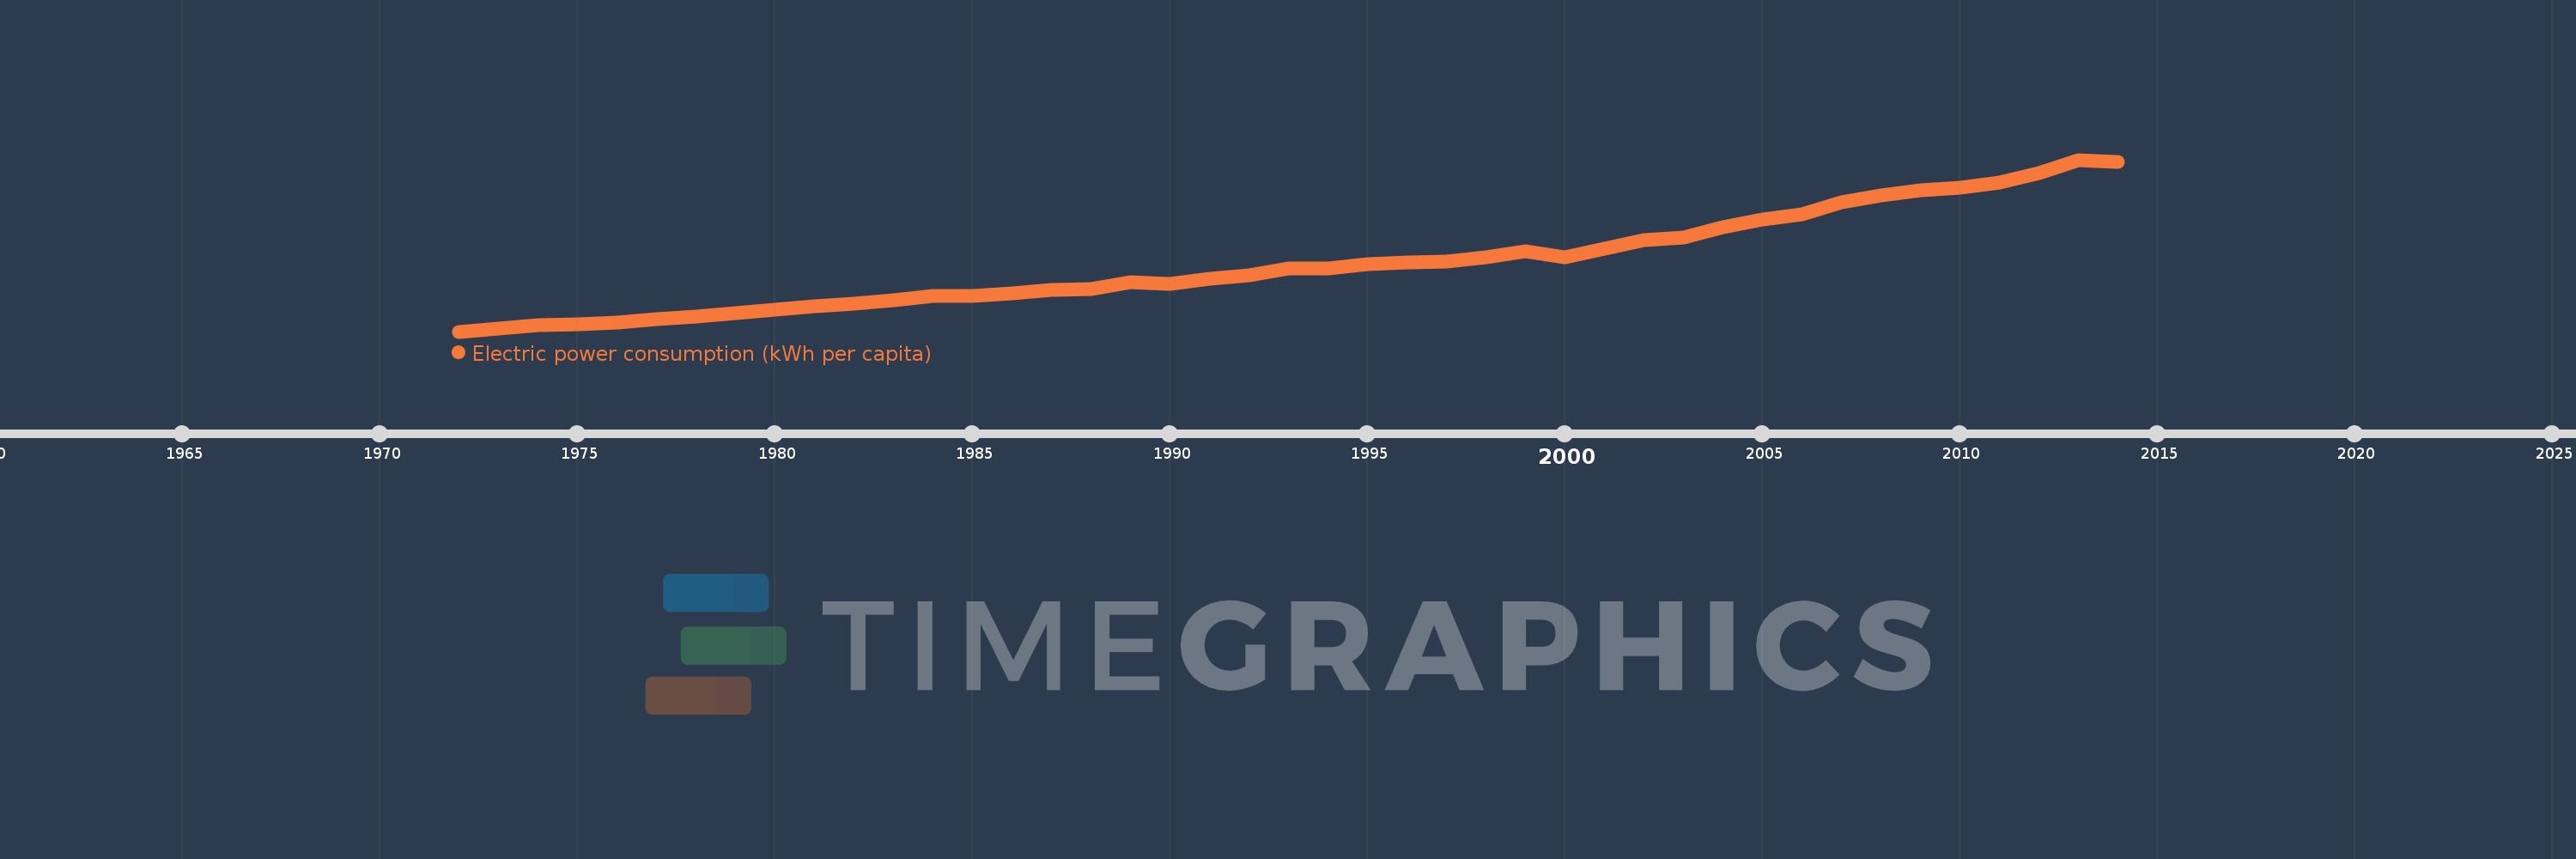
Electric power consumption (kWh per capita)
2014,2013,2012,2011,2010,2009,2008,2007,2006,2005,2004,2003,2002,2001,2000,1999,1998,1997,1996,1995,1994,1993,1992,1991,1990,1989,1988,1987,1986,1985,1984,1983,1982,1981,1980,1979,1978,1977,1976,1975,1974,1973,1972
This statistics in other country:
AlbaniaAlgeriaAngolaArab WorldArgentinaArmeniaAustraliaAustriaAzerbaijanBahrainBangladeshBelarusBelgiumBeninBoliviaBosnia and HerzegovinaBotswanaBrazilBrunei DarussalamBulgariaCambodiaCameroonCanadaCentral Europe and the BalticsChileChinaColombiaCongo, Dem. Rep.Congo, Rep.Costa RicaCote d'IvoireCroatiaCubaCuracaoCyprusCzech RepublicDenmarkDominican RepublicEarly-demographic dividendEast Asia & PacificEast Asia & Pacific (excluding high income)East Asia & Pacific (IDA & IBRD countries)EcuadorEgypt, Arab Rep.El SalvadorEritreaEstoniaEthiopiaEuro areaEurope & Central AsiaEurope & Central Asia (excluding high income)Europe & Central Asia (IDA & IBRD countries)European UnionFinlandFragile and conflict affected situationsFranceGabonGeorgiaGermanyGhanaGibraltarGreeceGuatemalaHaitiHeavily indebted poor countries (HIPC)High incomeHondurasHong Kong SAR, ChinaHungaryIBRD onlyIcelandIDA & IBRD totalIDA blendIDA onlyIDA totalIndiaIndonesiaIran, Islamic Rep.IraqIrelandIsraelItalyJamaicaJapanJordanKazakhstanKenyaKorea, Dem. People’s Rep.Korea, Rep.KosovoKuwaitKyrgyz RepublicLate-demographic dividendLatin America & Caribbean Latin America & Caribbean (excluding high income)Latin America & the Caribbean (IDA & IBRD countries)LatviaLeast developed countries: UN classificationLebanonLibyaLithuaniaLow & middle incomeLower middle incomeLuxembourgMacedonia, FYRMalaysiaMaltaMauritiusMexicoMiddle East & North AfricaMiddle East & North Africa (excluding high income)Middle East & North Africa (IDA & IBRD countries)Middle incomeMoldovaMongoliaMontenegroMoroccoMozambiqueMyanmarNamibiaNepalNetherlandsNew ZealandNicaraguaNigerNigeriaNorth AmericaNorwayOECD membersOmanPakistanPanamaParaguayPeruPhilippinesPolandPortugalPost-demographic dividendPre-demographic dividendQatarRomaniaRussian FederationSaudi ArabiaSenegalSerbiaSingaporeSlovak RepublicSloveniaSouth AfricaSouth AsiaSouth Asia (IDA & IBRD)South SudanSpainSri LankaSub-Saharan Africa Sub-Saharan Africa (excluding high income)Sub-Saharan Africa (IDA & IBRD countries)SudanSwedenSwitzerlandSyrian Arab RepublicTajikistanTanzaniaThailandTogoTrinidad and TobagoTunisiaTurkeyTurkmenistanUkraineUnited Arab EmiratesUnited KingdomUnited StatesUpper middle incomeUruguayUzbekistanVenezuela, RBVietnamWorldYemen, Rep.ZambiaZimbabwe Timeline:
This timeline shows a graph from 1972 to 2014 of Morocco. No data until 1971. Number of actual observations by date: 43.
Source name:
World Development Indicators
Source organization:
IEA Statistics © OECD/IEA 2014 (http://www.iea.org/stats/index.asp), subject to https://www.iea.org/t&c/termsandconditions/
Categories, topics:
Energy & Mining, Climate Change, Infrastructure
Last updated:
apr 23, 2017
Indicators value changes by year
Minimum:
124.894
jan 1, 1972
Maximum:
875.177
jan 1, 2013
At the date of observation
Value
Absolute change
Change from previous value
jan 1, 1972
124.894
+124.894
0.0%
jan 1, 1973
138.526
+13.633
10.92%
jan 1, 1974
151.722
+13.196
9.53%
jan 1, 1975
157.272
+5.549
3.66%
jan 1, 1976
162.703
+5.432
3.45%
jan 1, 1977
178.181
+15.478
9.51%
jan 1, 1978
191.773
+13.592
7.63%
jan 1, 1979
205.295
+13.522
7.05%
jan 1, 1980
221.688
+16.393
7.99%
jan 1, 1981
235.902
+14.214
6.41%
jan 1, 1982
247.71
+11.808
5.01%
jan 1, 1983
261.122
+13.411
5.41%
jan 1, 1984
279.331
+18.209
6.97%
jan 1, 1985
281.789
+2.459
0.88%
jan 1, 1986
293.28
+11.491
4.08%
jan 1, 1987
305.83
+12.55
4.28%
jan 1, 1988
309.709
+3.879
1.27%
jan 1, 1989
339.155
+29.446
9.51%
jan 1, 1990
333.778
-5.378
-1.59%
jan 1, 1991
357.112
+23.335
6.99%
jan 1, 1992
369.34
+12.228
3.42%
jan 1, 1993
399.707
+30.367
8.22%
jan 1, 1994
399.668
-0.039
-0.01%
jan 1, 1995
418.803
+19.135
4.79%
jan 1, 1996
428.468
+9.665
2.31%
jan 1, 1997
431.072
+2.604
0.61%
jan 1, 1998
448.271
+17.199
3.99%
jan 1, 1999
476.773
+28.502
6.36%
jan 1, 2000
450.561
-26.212
-5.5%
jan 1, 2001
487.383
+36.822
8.17%
jan 1, 2002
522.683
+35.301
7.24%
jan 1, 2003
534.542
+11.858
2.27%
jan 1, 2004
581.061
+46.52
8.7%
jan 1, 2005
612.732
+31.67
5.45%
jan 1, 2006
635.929
+23.197
3.79%
jan 1, 2007
690.714
+54.785
8.61%
jan 1, 2008
720.801
+30.087
4.36%
jan 1, 2009
741.518
+20.717
2.87%
jan 1, 2010
752.484
+10.966
1.48%
jan 1, 2011
777.071
+24.587
3.27%
jan 1, 2012
818.518
+41.447
5.33%
jan 1, 2013
875.177
+56.659
6.92%
jan 1, 2014
866.238
-8.939
-1.02%
Ranking of countries by current statistics by years


Comments: