29
/
en
AIzaSyAYiBZKx7MnpbEhh9jyipgxe19OcubqV5w
April 1, 2024
126049
El Salvador
SLV
true
2
1
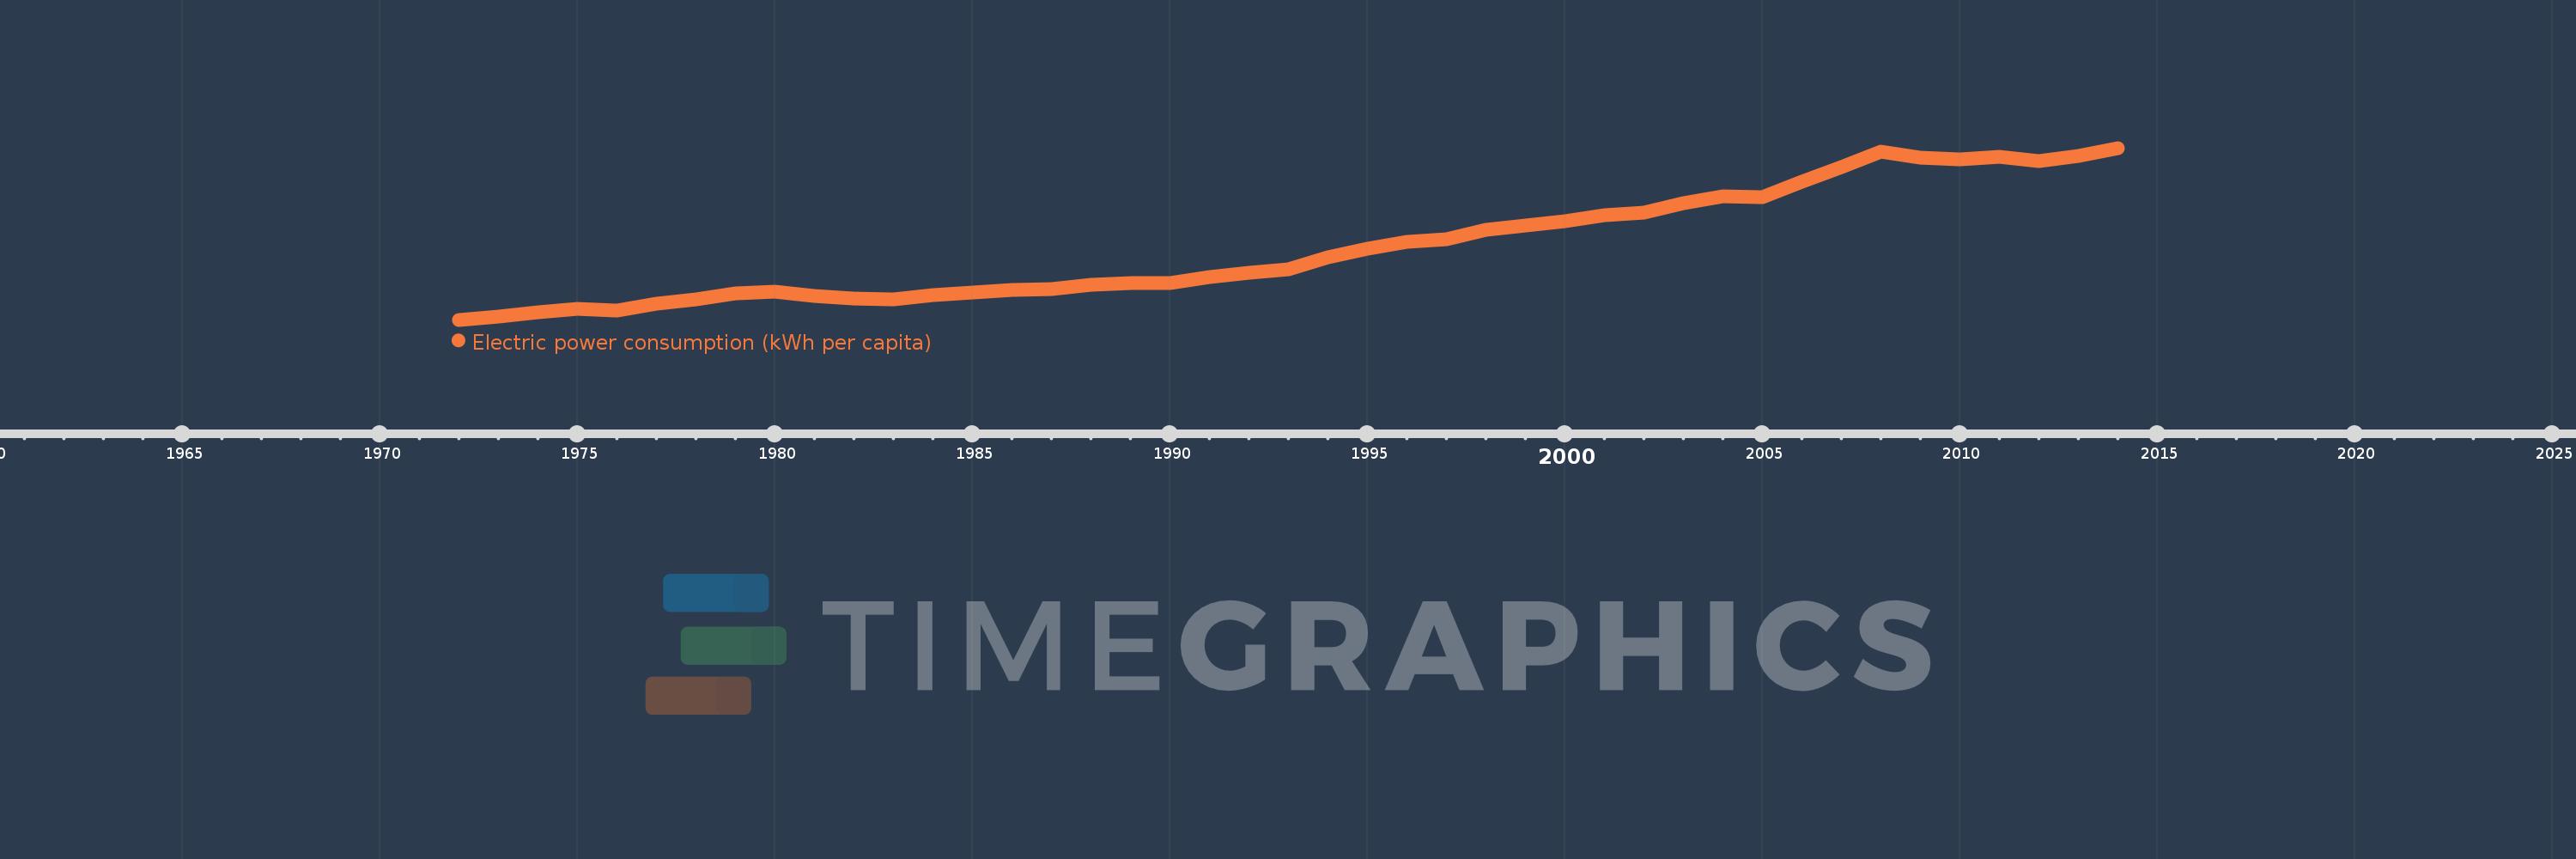
Electric power consumption (kWh per capita)
2014,2013,2012,2011,2010,2009,2008,2007,2006,2005,2004,2003,2002,2001,2000,1999,1998,1997,1996,1995,1994,1993,1992,1991,1990,1989,1988,1987,1986,1985,1984,1983,1982,1981,1980,1979,1978,1977,1976,1975,1974,1973,1972
This statistics in other country:
AlbaniaAlgeriaAngolaArab WorldArgentinaArmeniaAustraliaAustriaAzerbaijanBahrainBangladeshBelarusBelgiumBeninBoliviaBosnia and HerzegovinaBotswanaBrazilBrunei DarussalamBulgariaCambodiaCameroonCanadaCentral Europe and the BalticsChileChinaColombiaCongo, Dem. Rep.Congo, Rep.Costa RicaCote d'IvoireCroatiaCubaCuracaoCyprusCzech RepublicDenmarkDominican RepublicEarly-demographic dividendEast Asia & PacificEast Asia & Pacific (excluding high income)East Asia & Pacific (IDA & IBRD countries)EcuadorEgypt, Arab Rep.El SalvadorEritreaEstoniaEthiopiaEuro areaEurope & Central AsiaEurope & Central Asia (excluding high income)Europe & Central Asia (IDA & IBRD countries)European UnionFinlandFragile and conflict affected situationsFranceGabonGeorgiaGermanyGhanaGibraltarGreeceGuatemalaHaitiHeavily indebted poor countries (HIPC)High incomeHondurasHong Kong SAR, ChinaHungaryIBRD onlyIcelandIDA & IBRD totalIDA blendIDA onlyIDA totalIndiaIndonesiaIran, Islamic Rep.IraqIrelandIsraelItalyJamaicaJapanJordanKazakhstanKenyaKorea, Dem. People’s Rep.Korea, Rep.KosovoKuwaitKyrgyz RepublicLate-demographic dividendLatin America & Caribbean Latin America & Caribbean (excluding high income)Latin America & the Caribbean (IDA & IBRD countries)LatviaLeast developed countries: UN classificationLebanonLibyaLithuaniaLow & middle incomeLower middle incomeLuxembourgMacedonia, FYRMalaysiaMaltaMauritiusMexicoMiddle East & North AfricaMiddle East & North Africa (excluding high income)Middle East & North Africa (IDA & IBRD countries)Middle incomeMoldovaMongoliaMontenegroMoroccoMozambiqueMyanmarNamibiaNepalNetherlandsNew ZealandNicaraguaNigerNigeriaNorth AmericaNorwayOECD membersOmanPakistanPanamaParaguayPeruPhilippinesPolandPortugalPost-demographic dividendPre-demographic dividendQatarRomaniaRussian FederationSaudi ArabiaSenegalSerbiaSingaporeSlovak RepublicSloveniaSouth AfricaSouth AsiaSouth Asia (IDA & IBRD)South SudanSpainSri LankaSub-Saharan Africa Sub-Saharan Africa (excluding high income)Sub-Saharan Africa (IDA & IBRD countries)SudanSwedenSwitzerlandSyrian Arab RepublicTajikistanTanzaniaThailandTogoTrinidad and TobagoTunisiaTurkeyTurkmenistanUkraineUnited Arab EmiratesUnited KingdomUnited StatesUpper middle incomeUruguayUzbekistanVenezuela, RBVietnamWorldYemen, Rep.ZambiaZimbabwe Timeline:
This timeline shows a graph from 1972 to 2014 of El Salvador. No data until 1971. Number of actual observations by date: 43.
Source name:
World Development Indicators
Source organization:
IEA Statistics © OECD/IEA 2014 (http://www.iea.org/stats/index.asp), subject to https://www.iea.org/t&c/termsandconditions/
Categories, topics:
Energy & Mining, Climate Change, Infrastructure
Last updated:
apr 23, 2017
Indicators value changes by year
Minimum:
169.71
jan 1, 1972
Maximum:
914.996
jan 1, 2014
At the date of observation
Value
Absolute change
Change from previous value
jan 1, 1972
169.71
+169.71
0.0%
jan 1, 1973
181.765
+12.055
7.1%
jan 1, 1974
203.859
+22.094
12.16%
jan 1, 1975
216.085
+12.226
6.0%
jan 1, 1976
210.246
-5.839
-2.7%
jan 1, 1977
240.139
+29.893
14.22%
jan 1, 1978
259.886
+19.747
8.22%
jan 1, 1979
282.406
+22.52
8.67%
jan 1, 1980
290.525
+8.118
2.87%
jan 1, 1981
274.375
-16.15
-5.56%
jan 1, 1982
260.315
-14.06
-5.12%
jan 1, 1983
256.233
-4.082
-1.57%
jan 1, 1984
276.857
+20.625
8.05%
jan 1, 1985
287.11
+10.253
3.7%
jan 1, 1986
297.301
+10.191
3.55%
jan 1, 1987
302.014
+4.712
1.59%
jan 1, 1988
320.079
+18.065
5.98%
jan 1, 1989
329.648
+9.57
2.99%
jan 1, 1990
330.619
+0.97
0.29%
jan 1, 1991
353.574
+22.955
6.94%
jan 1, 1992
372.258
+18.684
5.28%
jan 1, 1993
386.674
+14.416
3.87%
jan 1, 1994
439.962
+53.288
13.78%
jan 1, 1995
476.482
+36.52
8.3%
jan 1, 1996
509.059
+32.577
6.84%
jan 1, 1997
520.434
+11.375
2.23%
jan 1, 1998
561.109
+40.675
7.82%
jan 1, 1999
576.701
+15.592
2.78%
jan 1, 2000
595.776
+19.075
3.31%
jan 1, 2001
623.039
+27.263
4.58%
jan 1, 2002
635.443
+12.404
1.99%
jan 1, 2003
677.187
+41.744
6.57%
jan 1, 2004
704.465
+27.278
4.03%
jan 1, 2005
701.593
-2.873
-0.41%
jan 1, 2006
768.764
+67.172
9.57%
jan 1, 2007
832.334
+63.57
8.27%
jan 1, 2008
899.704
+67.37
8.09%
jan 1, 2009
873.888
-25.815
-2.87%
jan 1, 2010
865.252
-8.637
-0.99%
jan 1, 2011
877.73
+12.478
1.44%
jan 1, 2012
857.113
-20.616
-2.35%
jan 1, 2013
879.578
+22.464
2.62%
jan 1, 2014
914.996
+35.418
4.03%
Ranking of countries by current statistics by years


Comments: