29
/
en
AIzaSyAYiBZKx7MnpbEhh9jyipgxe19OcubqV5w
April 1, 2024
113471
Cote d'Ivoire
CIV
true
2
1
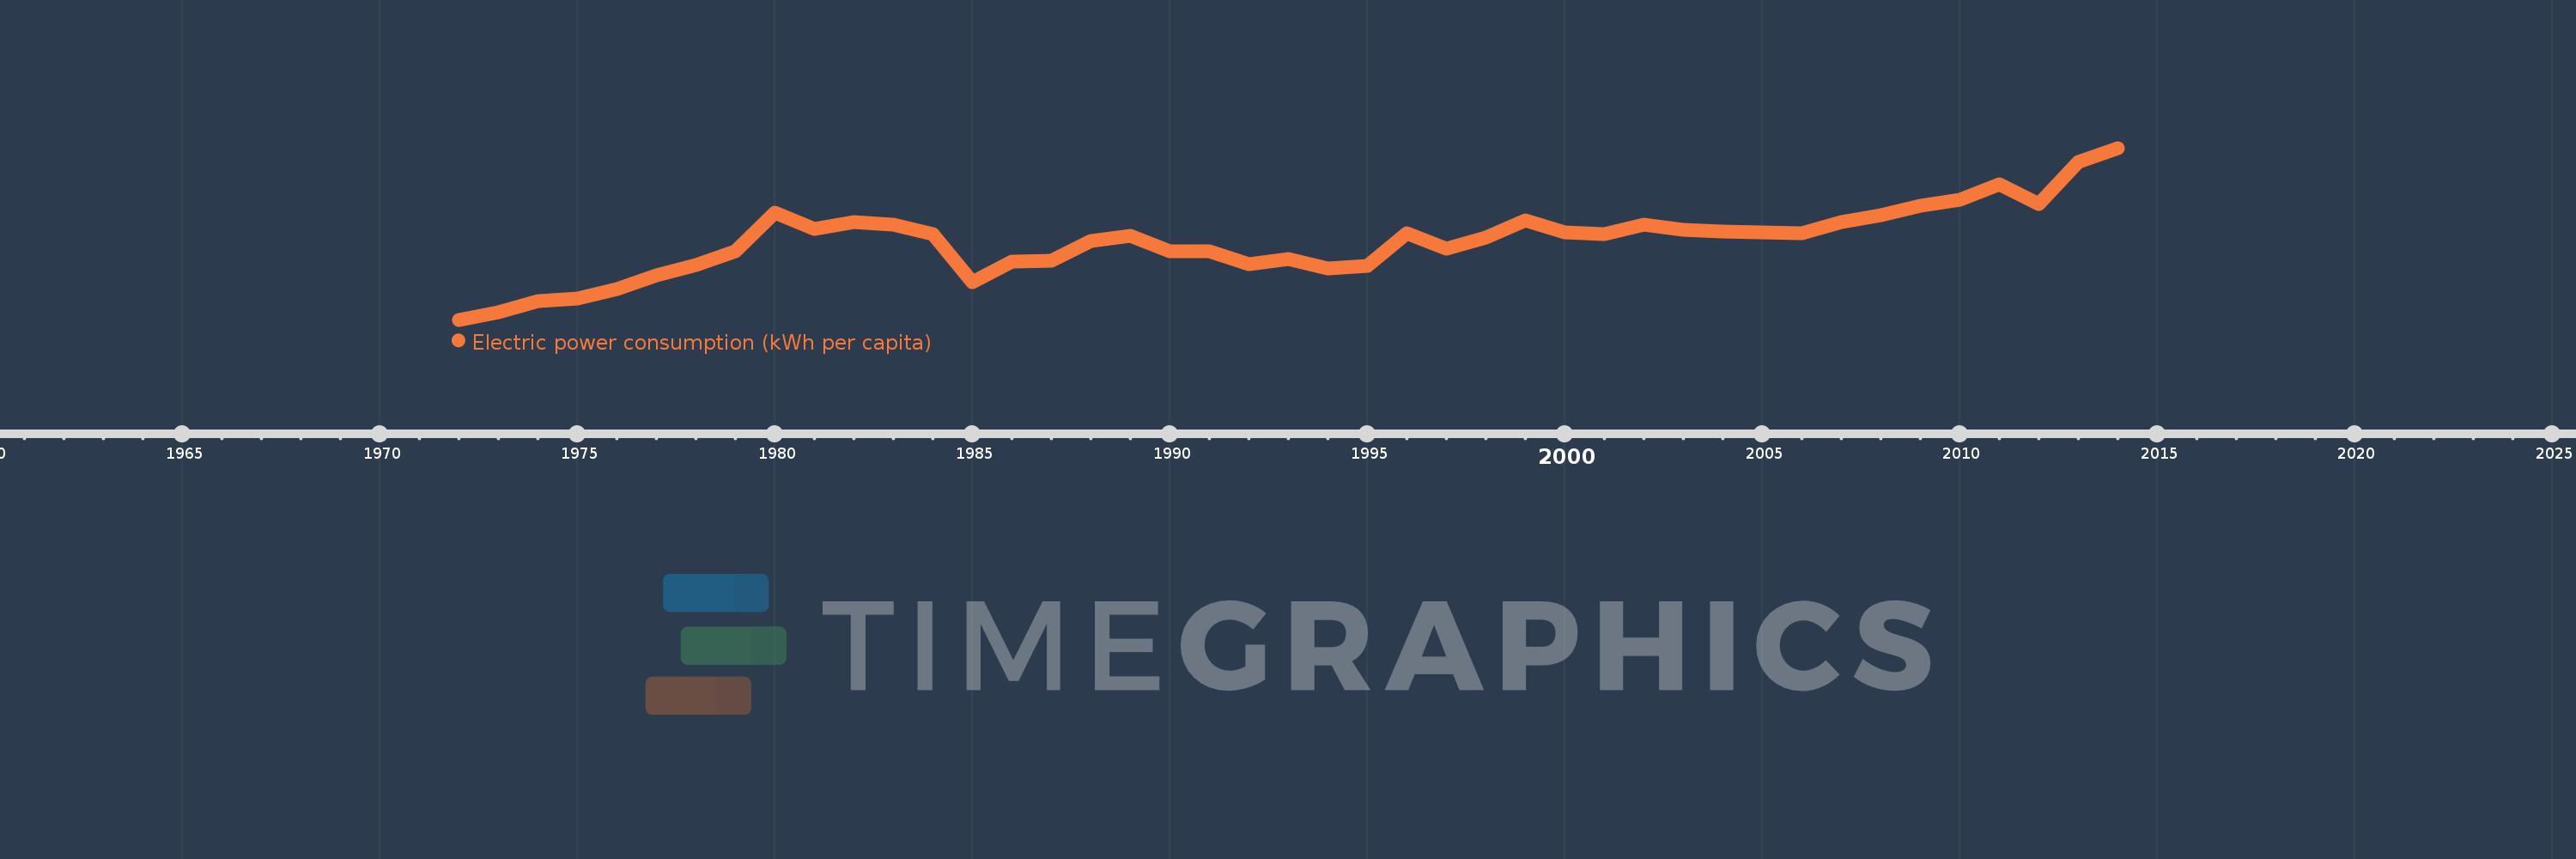
Electric power consumption (kWh per capita)
2014,2013,2012,2011,2010,2009,2008,2007,2006,2005,2004,2003,2002,2001,2000,1999,1998,1997,1996,1995,1994,1993,1992,1991,1990,1989,1988,1987,1986,1985,1984,1983,1982,1981,1980,1979,1978,1977,1976,1975,1974,1973,1972
This statistics in other country:
AlbaniaAlgeriaAngolaArab WorldArgentinaArmeniaAustraliaAustriaAzerbaijanBahrainBangladeshBelarusBelgiumBeninBoliviaBosnia and HerzegovinaBotswanaBrazilBrunei DarussalamBulgariaCambodiaCameroonCanadaCentral Europe and the BalticsChileChinaColombiaCongo, Dem. Rep.Congo, Rep.Costa RicaCote d'IvoireCroatiaCubaCuracaoCyprusCzech RepublicDenmarkDominican RepublicEarly-demographic dividendEast Asia & PacificEast Asia & Pacific (excluding high income)East Asia & Pacific (IDA & IBRD countries)EcuadorEgypt, Arab Rep.El SalvadorEritreaEstoniaEthiopiaEuro areaEurope & Central AsiaEurope & Central Asia (excluding high income)Europe & Central Asia (IDA & IBRD countries)European UnionFinlandFragile and conflict affected situationsFranceGabonGeorgiaGermanyGhanaGibraltarGreeceGuatemalaHaitiHeavily indebted poor countries (HIPC)High incomeHondurasHong Kong SAR, ChinaHungaryIBRD onlyIcelandIDA & IBRD totalIDA blendIDA onlyIDA totalIndiaIndonesiaIran, Islamic Rep.IraqIrelandIsraelItalyJamaicaJapanJordanKazakhstanKenyaKorea, Dem. People’s Rep.Korea, Rep.KosovoKuwaitKyrgyz RepublicLate-demographic dividendLatin America & Caribbean Latin America & Caribbean (excluding high income)Latin America & the Caribbean (IDA & IBRD countries)LatviaLeast developed countries: UN classificationLebanonLibyaLithuaniaLow & middle incomeLower middle incomeLuxembourgMacedonia, FYRMalaysiaMaltaMauritiusMexicoMiddle East & North AfricaMiddle East & North Africa (excluding high income)Middle East & North Africa (IDA & IBRD countries)Middle incomeMoldovaMongoliaMontenegroMoroccoMozambiqueMyanmarNamibiaNepalNetherlandsNew ZealandNicaraguaNigerNigeriaNorth AmericaNorwayOECD membersOmanPakistanPanamaParaguayPeruPhilippinesPolandPortugalPost-demographic dividendPre-demographic dividendQatarRomaniaRussian FederationSaudi ArabiaSenegalSerbiaSingaporeSlovak RepublicSloveniaSouth AfricaSouth AsiaSouth Asia (IDA & IBRD)South SudanSpainSri LankaSub-Saharan Africa Sub-Saharan Africa (excluding high income)Sub-Saharan Africa (IDA & IBRD countries)SudanSwedenSwitzerlandSyrian Arab RepublicTajikistanTanzaniaThailandTogoTrinidad and TobagoTunisiaTurkeyTurkmenistanUkraineUnited Arab EmiratesUnited KingdomUnited StatesUpper middle incomeUruguayUzbekistanVenezuela, RBVietnamWorldYemen, Rep.ZambiaZimbabwe Timeline:
This timeline shows a graph from 1972 to 2014 of Cote d'Ivoire. No data until 1971. Number of actual observations by date: 43.
Source name:
World Development Indicators
Source organization:
IEA Statistics © OECD/IEA 2014 (http://www.iea.org/stats/index.asp), subject to https://www.iea.org/t&c/termsandconditions/
Categories, topics:
Energy & Mining, Climate Change, Infrastructure
Last updated:
apr 23, 2017
Indicators value changes by year
Minimum:
94.213
jan 1, 1972
Maximum:
252.376
jan 1, 2014
At the date of observation
Value
Absolute change
Change from previous value
jan 1, 1972
94.213
+94.213
0.0%
jan 1, 1973
101.085
+6.873
7.29%
jan 1, 1974
111.104
+10.019
9.91%
jan 1, 1975
113.666
+2.563
2.31%
jan 1, 1976
122.306
+8.639
7.6%
jan 1, 1977
135.477
+13.171
10.77%
jan 1, 1978
144.25
+8.773
6.48%
jan 1, 1979
156.944
+12.695
8.8%
jan 1, 1980
193.115
+36.17
23.05%
jan 1, 1981
177.726
-15.389
-7.97%
jan 1, 1982
183.796
+6.071
3.42%
jan 1, 1983
181.618
-2.178
-1.19%
jan 1, 1984
173.393
-8.225
-4.53%
jan 1, 1985
128.671
-44.722
-25.79%
jan 1, 1986
147.568
+18.897
14.69%
jan 1, 1987
148.178
+0.61
0.41%
jan 1, 1988
166.819
+18.642
12.58%
jan 1, 1989
171.207
+4.388
2.63%
jan 1, 1990
157.433
-13.775
-8.05%
jan 1, 1991
157.243
-0.19
-0.12%
jan 1, 1992
145.624
-11.619
-7.39%
jan 1, 1993
150.304
+4.68
3.21%
jan 1, 1994
141.781
-8.523
-5.67%
jan 1, 1995
144.19
+2.409
1.7%
jan 1, 1996
173.836
+29.646
20.56%
jan 1, 1997
159.572
-14.264
-8.21%
jan 1, 1998
170.171
+10.598
6.64%
jan 1, 1999
185.333
+15.162
8.91%
jan 1, 2000
174.683
-10.65
-5.75%
jan 1, 2001
173.327
-1.356
-0.78%
jan 1, 2002
182.089
+8.762
5.06%
jan 1, 2003
177.127
-4.962
-2.73%
jan 1, 2004
175.456
-1.671
-0.94%
jan 1, 2005
175.031
-0.425
-0.24%
jan 1, 2006
173.774
-1.257
-0.72%
jan 1, 2007
184.352
+10.577
6.09%
jan 1, 2008
190.169
+5.817
3.16%
jan 1, 2009
199.152
+8.983
4.72%
jan 1, 2010
204.319
+5.167
2.59%
jan 1, 2011
219.306
+14.987
7.34%
jan 1, 2012
200.979
-18.327
-8.36%
jan 1, 2013
239.733
+38.754
19.28%
jan 1, 2014
252.376
+12.643
5.27%
Ranking of countries by current statistics by years


Comments: