29
/
en
AIzaSyAYiBZKx7MnpbEhh9jyipgxe19OcubqV5w
April 1, 2024
55447
Pre-demographic dividend
PRE
false
2
1
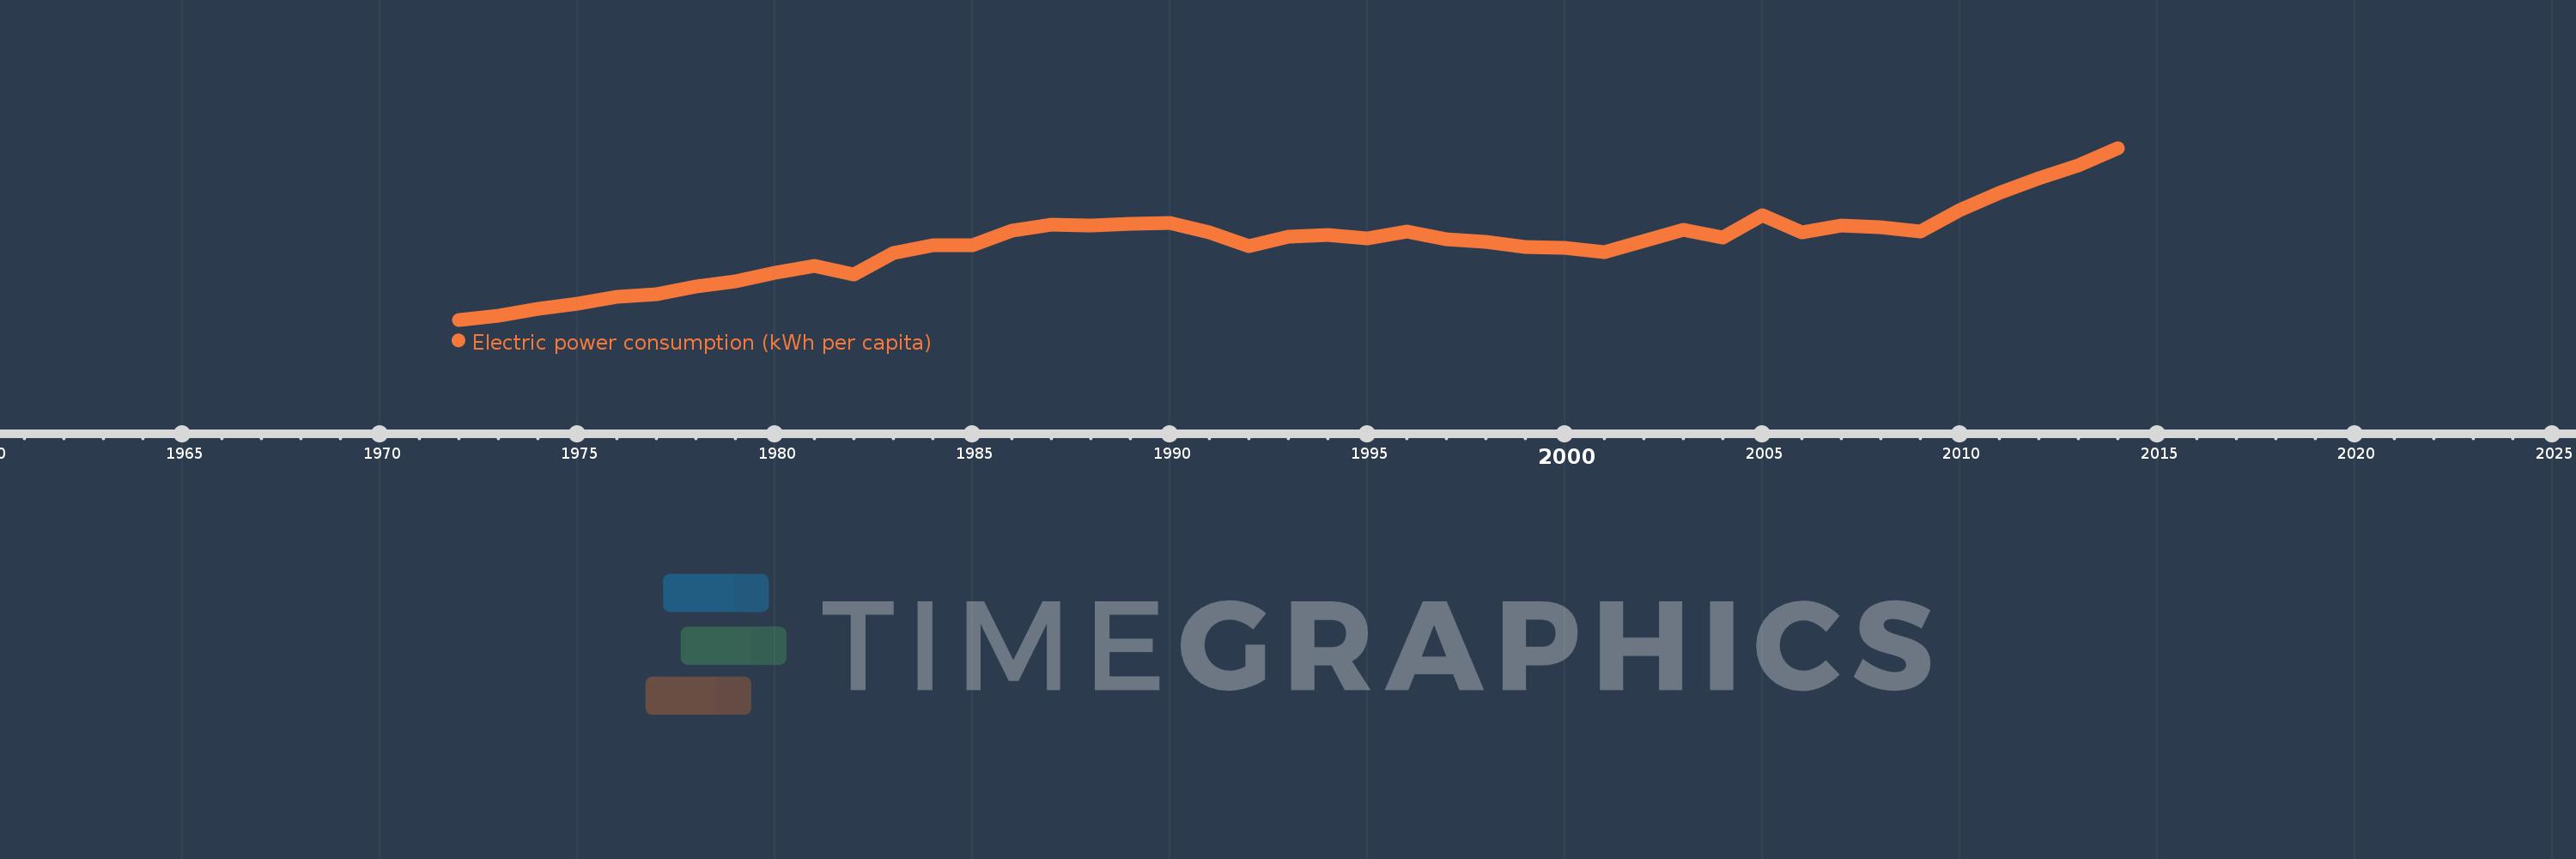
Electric power consumption (kWh per capita)
2014,2013,2012,2011,2010,2009,2008,2007,2006,2005,2004,2003,2002,2001,2000,1999,1998,1997,1996,1995,1994,1993,1992,1991,1990,1989,1988,1987,1986,1985,1984,1983,1982,1981,1980,1979,1978,1977,1976,1975,1974,1973,1972
This statistics in other country:
AlbaniaAlgeriaAngolaArab WorldArgentinaArmeniaAustraliaAustriaAzerbaijanBahrainBangladeshBelarusBelgiumBeninBoliviaBosnia and HerzegovinaBotswanaBrazilBrunei DarussalamBulgariaCambodiaCameroonCanadaCentral Europe and the BalticsChileChinaColombiaCongo, Dem. Rep.Congo, Rep.Costa RicaCote d'IvoireCroatiaCubaCuracaoCyprusCzech RepublicDenmarkDominican RepublicEarly-demographic dividendEast Asia & PacificEast Asia & Pacific (excluding high income)East Asia & Pacific (IDA & IBRD countries)EcuadorEgypt, Arab Rep.El SalvadorEritreaEstoniaEthiopiaEuro areaEurope & Central AsiaEurope & Central Asia (excluding high income)Europe & Central Asia (IDA & IBRD countries)European UnionFinlandFragile and conflict affected situationsFranceGabonGeorgiaGermanyGhanaGibraltarGreeceGuatemalaHaitiHeavily indebted poor countries (HIPC)High incomeHondurasHong Kong SAR, ChinaHungaryIBRD onlyIcelandIDA & IBRD totalIDA blendIDA onlyIDA totalIndiaIndonesiaIran, Islamic Rep.IraqIrelandIsraelItalyJamaicaJapanJordanKazakhstanKenyaKorea, Dem. People’s Rep.Korea, Rep.KosovoKuwaitKyrgyz RepublicLate-demographic dividendLatin America & Caribbean Latin America & Caribbean (excluding high income)Latin America & the Caribbean (IDA & IBRD countries)LatviaLeast developed countries: UN classificationLebanonLibyaLithuaniaLow & middle incomeLower middle incomeLuxembourgMacedonia, FYRMalaysiaMaltaMauritiusMexicoMiddle East & North AfricaMiddle East & North Africa (excluding high income)Middle East & North Africa (IDA & IBRD countries)Middle incomeMoldovaMongoliaMontenegroMoroccoMozambiqueMyanmarNamibiaNepalNetherlandsNew ZealandNicaraguaNigerNigeriaNorth AmericaNorwayOECD membersOmanPakistanPanamaParaguayPeruPhilippinesPolandPortugalPost-demographic dividendPre-demographic dividendQatarRomaniaRussian FederationSaudi ArabiaSenegalSerbiaSingaporeSlovak RepublicSloveniaSouth AfricaSouth AsiaSouth Asia (IDA & IBRD)South SudanSpainSri LankaSub-Saharan Africa Sub-Saharan Africa (excluding high income)Sub-Saharan Africa (IDA & IBRD countries)SudanSwedenSwitzerlandSyrian Arab RepublicTajikistanTanzaniaThailandTogoTrinidad and TobagoTunisiaTurkeyTurkmenistanUkraineUnited Arab EmiratesUnited KingdomUnited StatesUpper middle incomeUruguayUzbekistanVenezuela, RBVietnamWorldYemen, Rep.ZambiaZimbabwe Timeline:
This timeline shows a graph from 1972 to 2014 of Pre-demographic dividend. No data until 1971. Number of actual observations by date: 43.
Source name:
World Development Indicators
Source organization:
IEA Statistics © OECD/IEA 2014 (http://www.iea.org/stats/index.asp), subject to https://www.iea.org/t&c/termsandconditions/
Categories, topics:
Energy & Mining, Climate Change, Infrastructure
Last updated:
apr 23, 2017
Indicators value changes by year
Minimum:
101.512
jan 1, 1972
Maximum:
271.173
jan 1, 2014
At the date of observation
Value
Absolute change
Change from previous value
jan 1, 1972
101.512
+101.512
0.0%
jan 1, 1973
105.31
+3.798
3.74%
jan 1, 1974
111.874
+6.565
6.23%
jan 1, 1975
117.257
+5.382
4.81%
jan 1, 1976
123.762
+6.505
5.55%
jan 1, 1977
126.67
+2.908
2.35%
jan 1, 1978
134.135
+7.464
5.89%
jan 1, 1979
139.472
+5.338
3.98%
jan 1, 1980
147.495
+8.023
5.75%
jan 1, 1981
154.433
+6.937
4.7%
jan 1, 1982
146.208
-8.225
-5.33%
jan 1, 1983
167.437
+21.229
14.52%
jan 1, 1984
175.096
+7.659
4.57%
jan 1, 1985
175.027
-0.069
-0.04%
jan 1, 1986
189.3
+14.273
8.15%
jan 1, 1987
195.664
+6.364
3.36%
jan 1, 1988
194.596
-1.068
-0.55%
jan 1, 1989
195.85
+1.254
0.64%
jan 1, 1990
196.878
+1.028
0.52%
jan 1, 1991
187.597
-9.281
-4.71%
jan 1, 1992
173.995
-13.602
-7.25%
jan 1, 1993
183.94
+9.945
5.72%
jan 1, 1994
185.234
+1.294
0.7%
jan 1, 1995
182.208
-3.025
-1.63%
jan 1, 1996
188.65
+6.442
3.54%
jan 1, 1997
181.287
-7.363
-3.9%
jan 1, 1998
178.307
-2.98
-1.64%
jan 1, 1999
173.72
-4.587
-2.57%
jan 1, 2000
172.393
-1.327
-0.76%
jan 1, 2001
168.178
-4.215
-2.45%
jan 1, 2002
179.122
+10.944
6.51%
jan 1, 2003
190.275
+11.153
6.23%
jan 1, 2004
182.548
-7.727
-4.06%
jan 1, 2005
204.941
+22.393
12.27%
jan 1, 2006
187.37
-17.571
-8.57%
jan 1, 2007
194.287
+6.917
3.69%
jan 1, 2008
192.584
-1.703
-0.88%
jan 1, 2009
188.701
-3.882
-2.02%
jan 1, 2010
210.038
+21.337
11.31%
jan 1, 2011
226.806
+16.768
7.98%
jan 1, 2012
240.845
+14.038
6.19%
jan 1, 2013
253.657
+12.813
5.32%
jan 1, 2014
271.173
+17.515
6.91%
Ranking of countries by current statistics by years


Comments: