29
/
en
AIzaSyAYiBZKx7MnpbEhh9jyipgxe19OcubqV5w
April 1, 2024
59697
Sub-Saharan Africa (excluding high income)
SSA
false
2
1
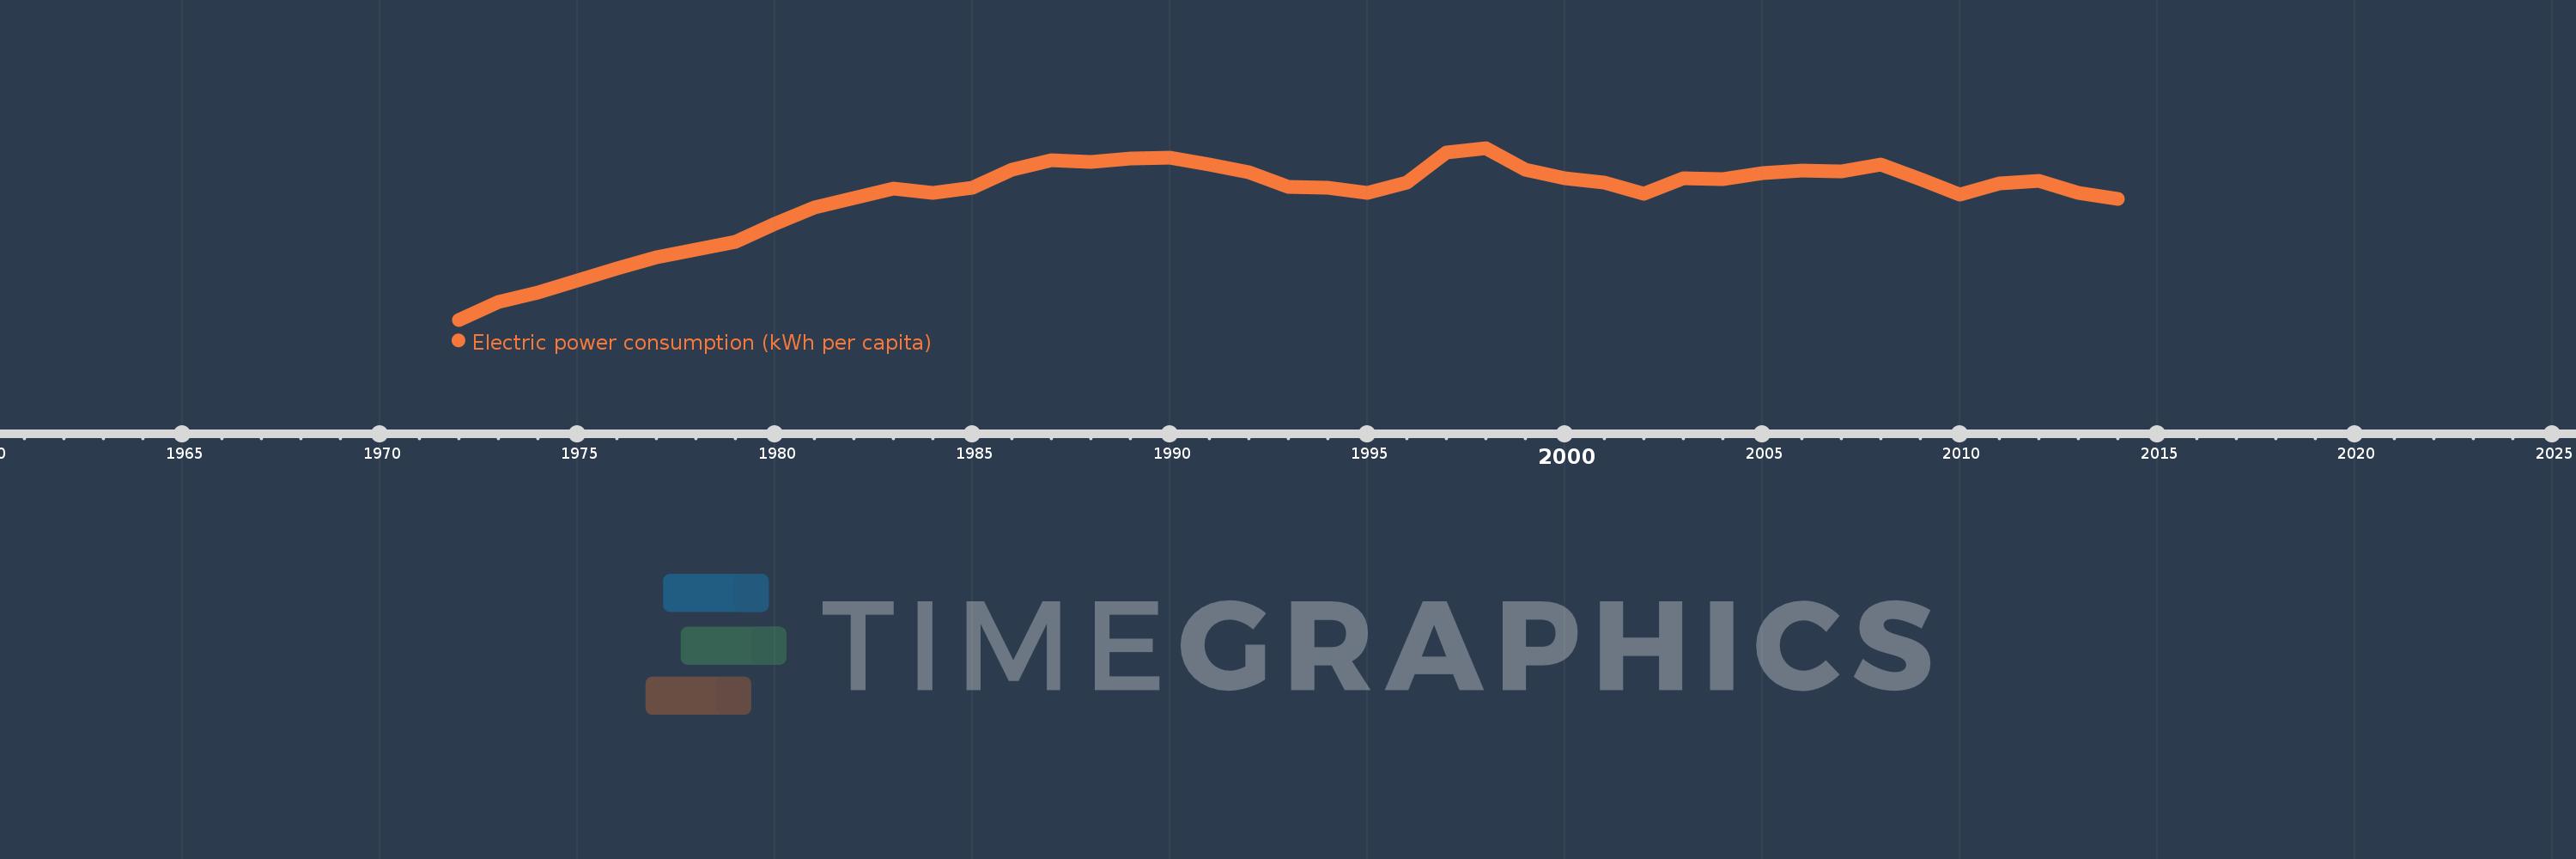
Electric power consumption (kWh per capita)
2014,2013,2012,2011,2010,2009,2008,2007,2006,2005,2004,2003,2002,2001,2000,1999,1998,1997,1996,1995,1994,1993,1992,1991,1990,1989,1988,1987,1986,1985,1984,1983,1982,1981,1980,1979,1978,1977,1976,1975,1974,1973,1972
This statistics in other country:
AlbaniaAlgeriaAngolaArab WorldArgentinaArmeniaAustraliaAustriaAzerbaijanBahrainBangladeshBelarusBelgiumBeninBoliviaBosnia and HerzegovinaBotswanaBrazilBrunei DarussalamBulgariaCambodiaCameroonCanadaCentral Europe and the BalticsChileChinaColombiaCongo, Dem. Rep.Congo, Rep.Costa RicaCote d'IvoireCroatiaCubaCuracaoCyprusCzech RepublicDenmarkDominican RepublicEarly-demographic dividendEast Asia & PacificEast Asia & Pacific (excluding high income)East Asia & Pacific (IDA & IBRD countries)EcuadorEgypt, Arab Rep.El SalvadorEritreaEstoniaEthiopiaEuro areaEurope & Central AsiaEurope & Central Asia (excluding high income)Europe & Central Asia (IDA & IBRD countries)European UnionFinlandFragile and conflict affected situationsFranceGabonGeorgiaGermanyGhanaGibraltarGreeceGuatemalaHaitiHeavily indebted poor countries (HIPC)High incomeHondurasHong Kong SAR, ChinaHungaryIBRD onlyIcelandIDA & IBRD totalIDA blendIDA onlyIDA totalIndiaIndonesiaIran, Islamic Rep.IraqIrelandIsraelItalyJamaicaJapanJordanKazakhstanKenyaKorea, Dem. People’s Rep.Korea, Rep.KosovoKuwaitKyrgyz RepublicLate-demographic dividendLatin America & Caribbean Latin America & Caribbean (excluding high income)Latin America & the Caribbean (IDA & IBRD countries)LatviaLeast developed countries: UN classificationLebanonLibyaLithuaniaLow & middle incomeLower middle incomeLuxembourgMacedonia, FYRMalaysiaMaltaMauritiusMexicoMiddle East & North AfricaMiddle East & North Africa (excluding high income)Middle East & North Africa (IDA & IBRD countries)Middle incomeMoldovaMongoliaMontenegroMoroccoMozambiqueMyanmarNamibiaNepalNetherlandsNew ZealandNicaraguaNigerNigeriaNorth AmericaNorwayOECD membersOmanPakistanPanamaParaguayPeruPhilippinesPolandPortugalPost-demographic dividendPre-demographic dividendQatarRomaniaRussian FederationSaudi ArabiaSenegalSerbiaSingaporeSlovak RepublicSloveniaSouth AfricaSouth AsiaSouth Asia (IDA & IBRD)South SudanSpainSri LankaSub-Saharan Africa Sub-Saharan Africa (excluding high income)Sub-Saharan Africa (IDA & IBRD countries)SudanSwedenSwitzerlandSyrian Arab RepublicTajikistanTanzaniaThailandTogoTrinidad and TobagoTunisiaTurkeyTurkmenistanUkraineUnited Arab EmiratesUnited KingdomUnited StatesUpper middle incomeUruguayUzbekistanVenezuela, RBVietnamWorldYemen, Rep.ZambiaZimbabwe Timeline:
This timeline shows a graph from 1972 to 2014 of Sub-Saharan Africa (excluding high income). No data until 1971. Number of actual observations by date: 43.
Source name:
World Development Indicators
Source organization:
IEA Statistics © OECD/IEA 2014 (http://www.iea.org/stats/index.asp), subject to https://www.iea.org/t&c/termsandconditions/
Categories, topics:
Energy & Mining, Climate Change, Infrastructure
Last updated:
apr 23, 2017
Indicators value changes by year
Minimum:
323.694
jan 1, 1972
Maximum:
557.914
jan 1, 1998
At the date of observation
Value
Absolute change
Change from previous value
jan 1, 1972
323.694
+323.694
0.0%
jan 1, 1973
347.357
+23.662
7.31%
jan 1, 1974
360.706
+13.349
3.84%
jan 1, 1975
377.452
+16.746
4.64%
jan 1, 1976
393.134
+15.681
4.15%
jan 1, 1977
408.59
+15.457
3.93%
jan 1, 1978
419.821
+11.231
2.75%
jan 1, 1979
429.422
+9.6
2.29%
jan 1, 1980
454.198
+24.776
5.77%
jan 1, 1981
477.083
+22.886
5.04%
jan 1, 1982
489.282
+12.199
2.56%
jan 1, 1983
502.792
+13.51
2.76%
jan 1, 1984
496.337
-6.455
-1.28%
jan 1, 1985
503.458
+7.121
1.43%
jan 1, 1986
528.406
+24.947
4.96%
jan 1, 1987
540.765
+12.36
2.34%
jan 1, 1988
538.242
-2.524
-0.47%
jan 1, 1989
543.809
+5.567
1.03%
jan 1, 1990
545.206
+1.397
0.26%
jan 1, 1991
535.833
-9.373
-1.72%
jan 1, 1992
525.051
-10.782
-2.01%
jan 1, 1993
504.416
-20.634
-3.93%
jan 1, 1994
503.387
-1.029
-0.2%
jan 1, 1995
496.898
-6.489
-1.29%
jan 1, 1996
510.901
+14.003
2.82%
jan 1, 1997
551.542
+40.641
7.95%
jan 1, 1998
557.914
+6.372
1.16%
jan 1, 1999
528.765
-29.149
-5.22%
jan 1, 2000
517.094
-11.671
-2.21%
jan 1, 2001
510.82
-6.274
-1.21%
jan 1, 2002
495.252
-15.567
-3.05%
jan 1, 2003
516.097
+20.845
4.21%
jan 1, 2004
515.18
-0.917
-0.18%
jan 1, 2005
523.057
+7.877
1.53%
jan 1, 2006
527.201
+4.144
0.79%
jan 1, 2007
525.636
-1.564
-0.3%
jan 1, 2008
535.011
+9.374
1.78%
jan 1, 2009
515.336
-19.675
-3.68%
jan 1, 2010
493.76
-21.576
-4.19%
jan 1, 2011
508.999
+15.239
3.09%
jan 1, 2012
513.568
+4.569
0.9%
jan 1, 2013
496.392
-17.176
-3.34%
jan 1, 2014
488.059
-8.332
-1.68%
Ranking of countries by current statistics by years


Comments: