29
/
en
AIzaSyAYiBZKx7MnpbEhh9jyipgxe19OcubqV5w
April 1, 2024
77815
Bangladesh
BGD
true
2
1
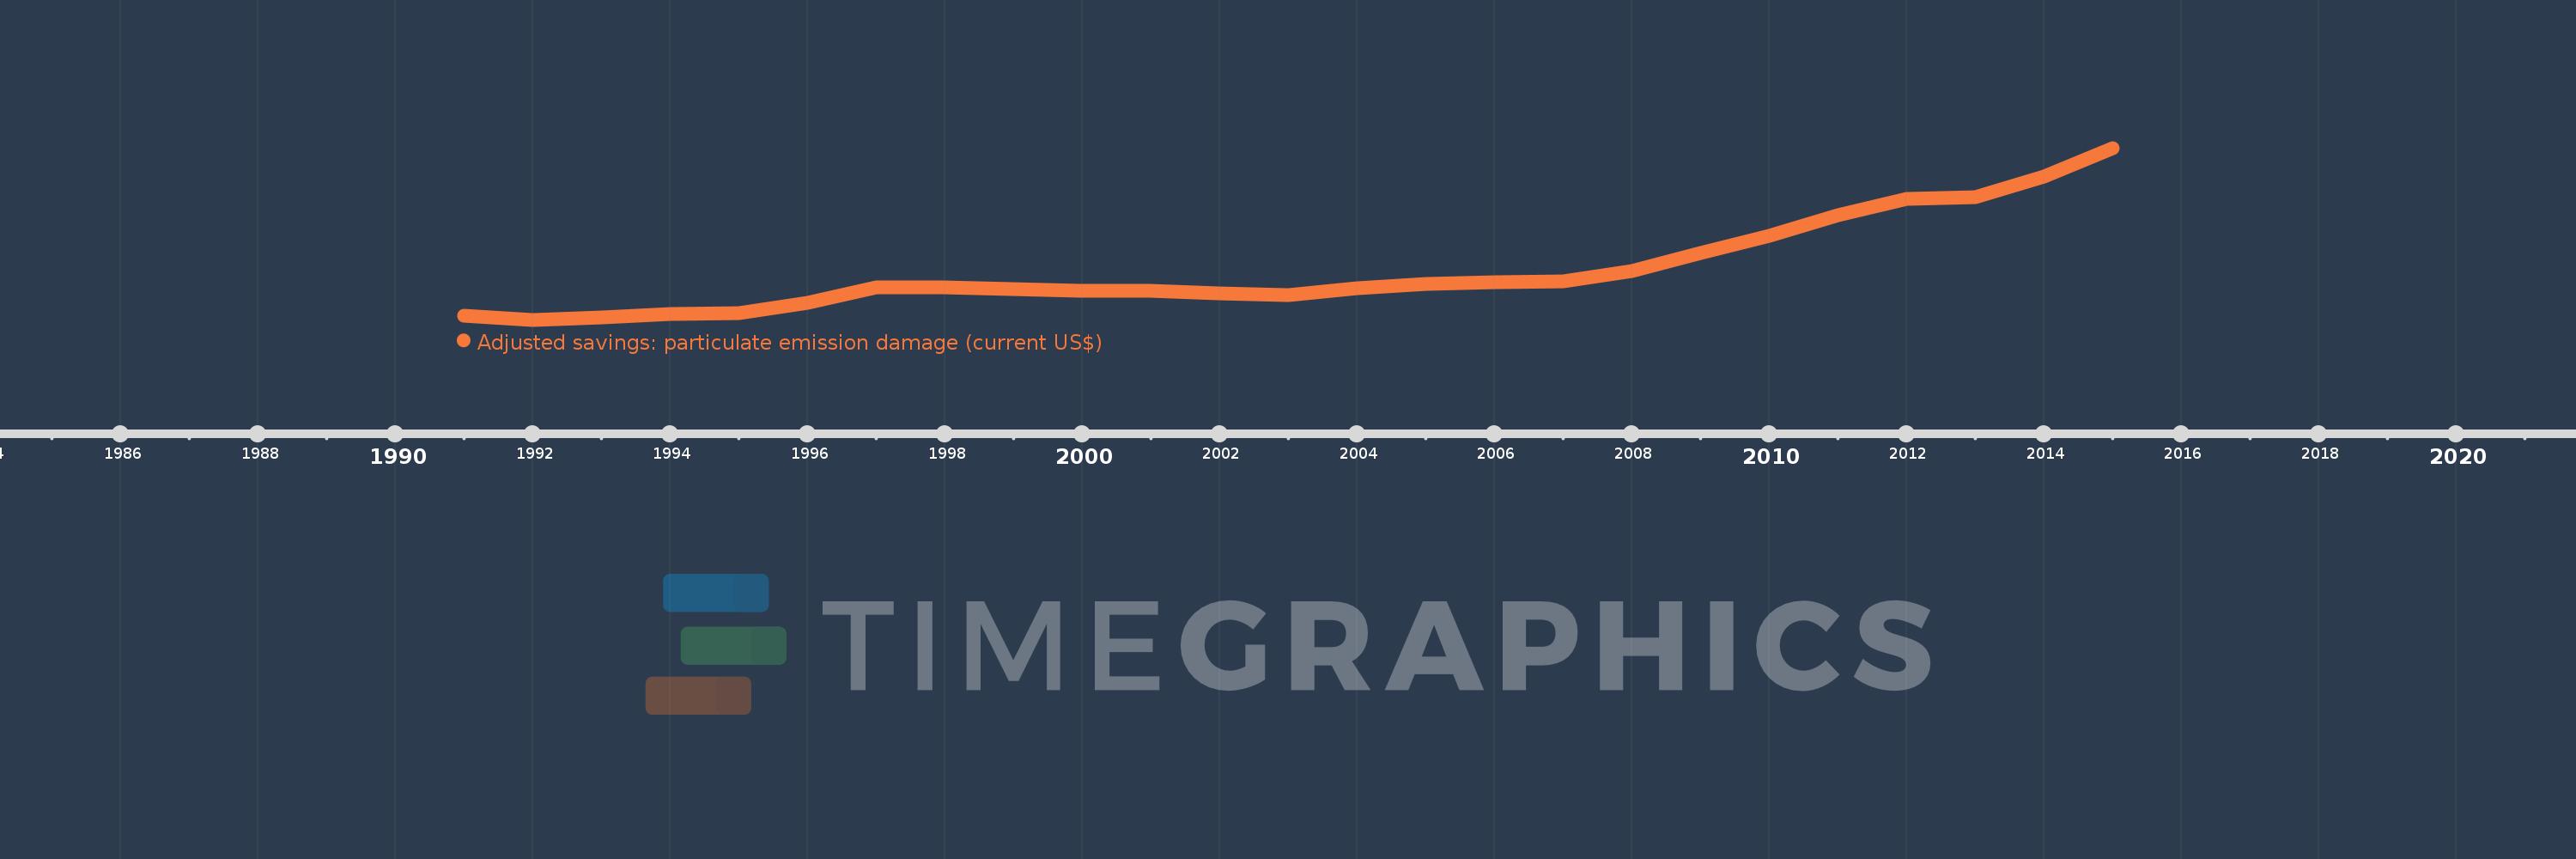
Adjusted savings: particulate emission damage (current US$)
2015,2014,2013,2012,2011,2010,2009,2008,2007,2006,2005,2004,2003,2002,2001,2000,1999,1998,1997,1996,1995,1994,1993,1992,1991
This statistics in other country:
AfghanistanAlbaniaAlgeriaAndorraAngolaAntigua and BarbudaArgentinaArmeniaAustraliaAustriaAzerbaijanBahamas, TheBahrainBangladeshBarbadosBelarusBelgiumBelizeBeninBhutanBoliviaBosnia and HerzegovinaBotswanaBrazilBrunei DarussalamBulgariaBurkina FasoBurundiCabo VerdeCambodiaCameroonCanadaCentral African RepublicChadChileChinaColombiaComorosCongo, Dem. Rep.Congo, Rep.Costa RicaCote d'IvoireCroatiaCubaCyprusCzech RepublicDenmarkDjiboutiDominicaDominican RepublicEcuadorEgypt, Arab Rep.El SalvadorEquatorial GuineaEritreaEstoniaEthiopiaFijiFinlandFranceGabonGambia, TheGeorgiaGermanyGhanaGreeceGrenadaGuatemalaGuineaGuinea-BissauGuyanaHaitiHondurasHong Kong SAR, ChinaHungaryIcelandIndiaIndonesiaIran, Islamic Rep.IraqIrelandIsraelItalyJamaicaJapanJordanKazakhstanKenyaKorea, Dem. People’s Rep.Korea, Rep.KuwaitKyrgyz RepublicLao PDRLatviaLebanonLesothoLiberiaLibyaLithuaniaLuxembourgMacao SAR, ChinaMacedonia, FYRMadagascarMalawiMalaysiaMaldivesMaliMaltaMauritaniaMauritiusMexicoMoldovaMonacoMongoliaMontenegroMoroccoMozambiqueMyanmarNamibiaNepalNetherlandsNew ZealandNicaraguaNigerNigeriaNorwayOmanPakistanPanamaPapua New GuineaParaguayPeruPhilippinesPolandPortugalPuerto RicoQatarRomaniaRussian FederationRwandaSan MarinoSao Tome and PrincipeSaudi ArabiaSenegalSerbiaSierra LeoneSingaporeSlovak RepublicSloveniaSolomon IslandsSomaliaSouth AfricaSpainSri LankaSt. Kitts and NevisSt. LuciaSt. Vincent and the GrenadinesSudanSurinameSwazilandSwedenSwitzerlandSyrian Arab RepublicTajikistanTanzaniaThailandTimor-LesteTogoTrinidad and TobagoTunisiaTurkeyTurkmenistanUgandaUkraineUnited Arab EmiratesUnited KingdomUnited StatesUruguayUzbekistanVanuatuVenezuela, RBVietnamWest Bank and GazaYemen, Rep.ZambiaZimbabwe Timeline:
This timeline shows a graph from 1991 to 2015 of Bangladesh. No data until 1990. Number of actual observations by date: 25.
Source name:
World Development Indicators
Source organization:
Data on health impacts from exposure to ambient PM2.5 pollution and household air pollution are from the Global Burden of Disease 2010 study. Data are provided by the Institute for Health Metrics and Evaluation at the University of Washington.
Categories, topics:
Economy & Growth, Environment
Last updated:
apr 23, 2017
Indicators value changes by year
Minimum:
331.719 mln
jan 1, 1992
Maximum:
1.104 bln
jan 1, 2015
At the date of observation
Value
Absolute change
Change from previous value
jan 1, 1991
351.366 mln
+351.366 mln
0.0%
jan 1, 1992
331.719 mln
-19.647 mln
-5.59%
jan 1, 1993
343.921 mln
+12.202 mln
3.68%
jan 1, 1994
356.968 mln
+13.047 mln
3.79%
jan 1, 1995
362.453 mln
+5.485 mln
1.54%
jan 1, 1996
406.277 mln
+43.824 mln
12.09%
jan 1, 1997
476.282 mln
+70.005 mln
17.23%
jan 1, 1998
476.483 mln
+200.775K
0.04%
jan 1, 1999
468.816 mln
-7.667 mln
-1.61%
jan 1, 2000
460.827 mln
-7.989 mln
-1.7%
jan 1, 2001
460.166 mln
-660.895K
-0.14%
jan 1, 2002
449.865 mln
-10.301 mln
-2.24%
jan 1, 2003
443.76 mln
-6.105 mln
-1.36%
jan 1, 2004
474.394 mln
+30.635 mln
6.9%
jan 1, 2005
493.637 mln
+19.242 mln
4.06%
jan 1, 2006
500.831 mln
+7.194 mln
1.46%
jan 1, 2007
505.597 mln
+4.766 mln
0.95%
jan 1, 2008
550.945 mln
+45.348 mln
8.97%
jan 1, 2009
630.719 mln
+79.774 mln
14.48%
jan 1, 2010
710.165 mln
+79.446 mln
12.6%
jan 1, 2011
802.946 mln
+92.781 mln
13.06%
jan 1, 2012
873.343 mln
+70.398 mln
8.77%
jan 1, 2013
883.105 mln
+9.761 mln
1.12%
jan 1, 2014
976.36 mln
+93.255 mln
10.56%
jan 1, 2015
1.104 bln
+127.614 mln
13.07%
Ranking of countries by current statistics by years


Comments: