29
/
en
AIzaSyAYiBZKx7MnpbEhh9jyipgxe19OcubqV5w
April 1, 2024
245186
South Africa
ZAF
true
2
1
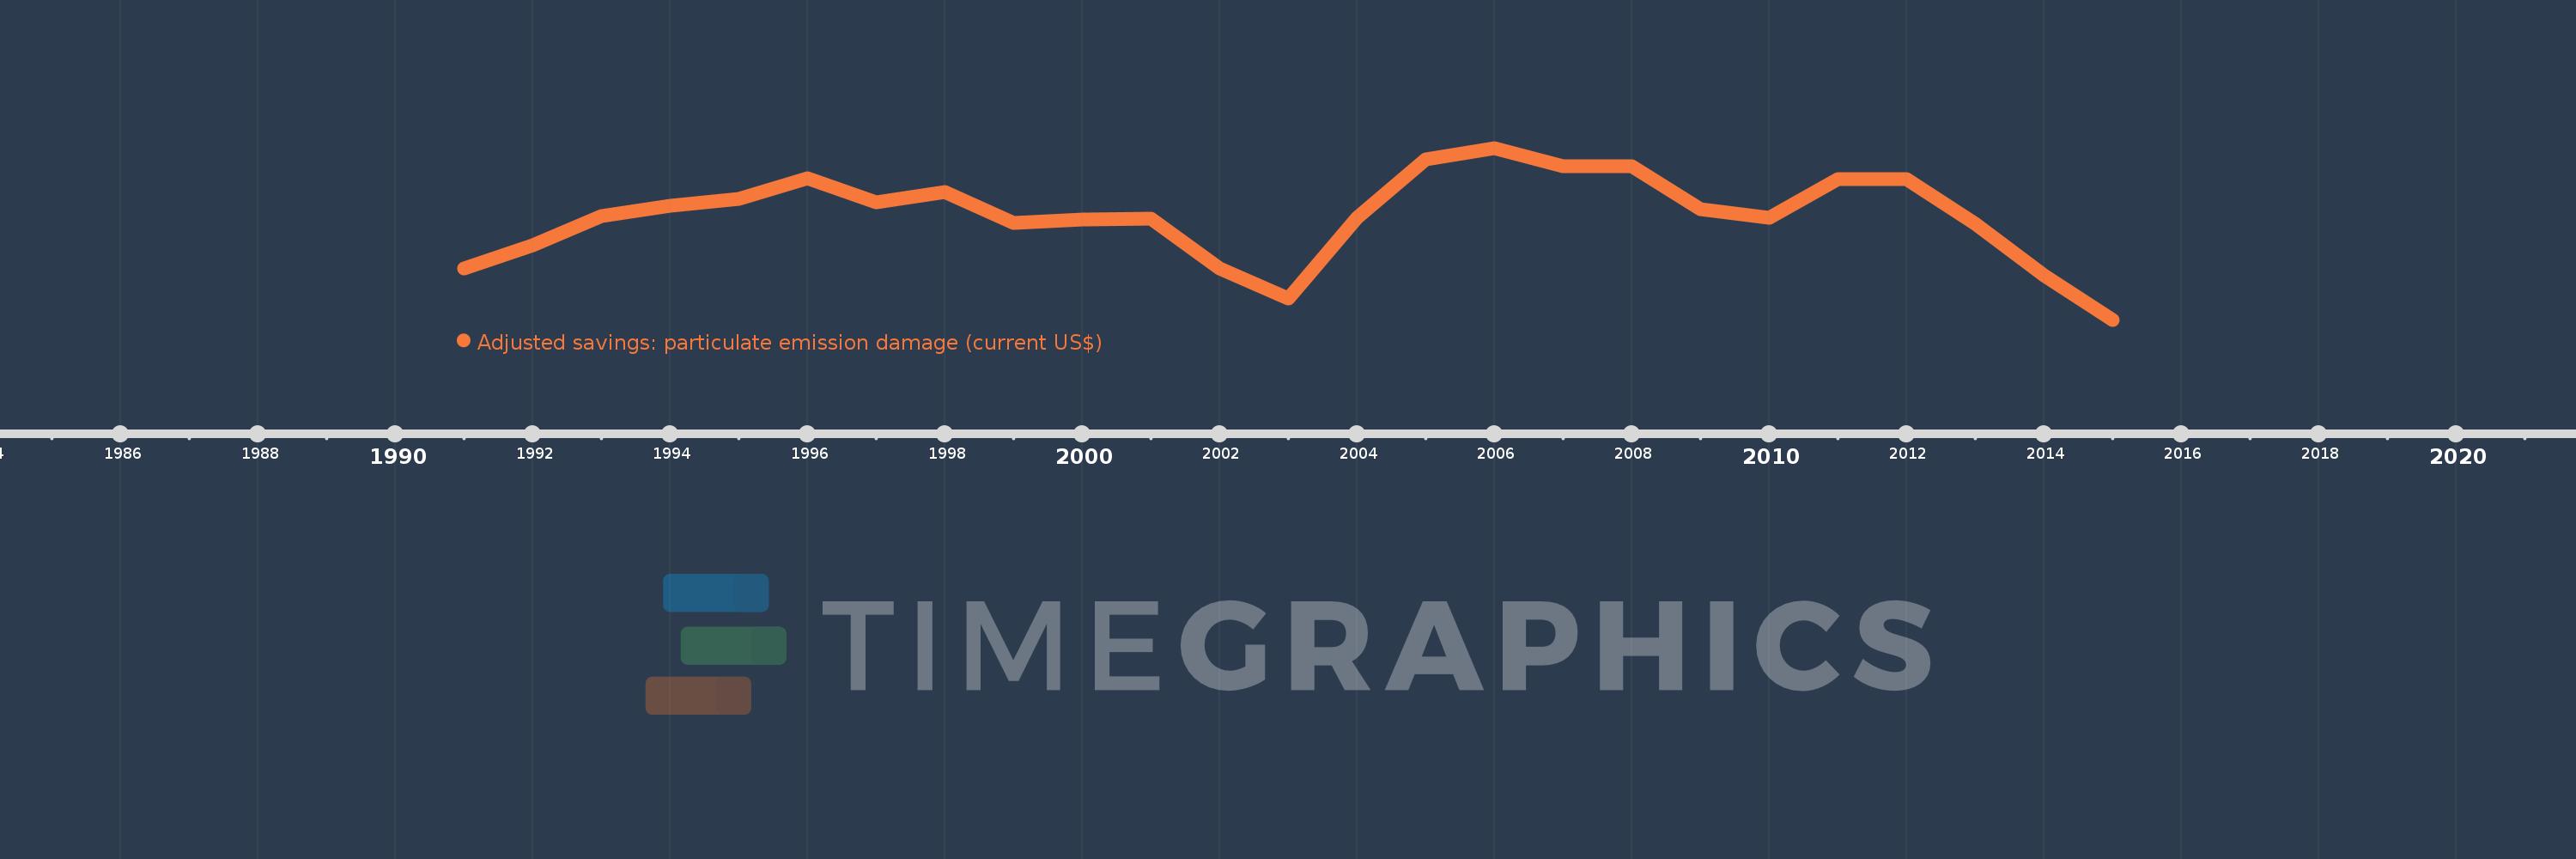
Adjusted savings: particulate emission damage (current US$)
2015,2014,2013,2012,2011,2010,2009,2008,2007,2006,2005,2004,2003,2002,2001,2000,1999,1998,1997,1996,1995,1994,1993,1992,1991
This statistics in other country:
AfghanistanAlbaniaAlgeriaAndorraAngolaAntigua and BarbudaArgentinaArmeniaAustraliaAustriaAzerbaijanBahamas, TheBahrainBangladeshBarbadosBelarusBelgiumBelizeBeninBhutanBoliviaBosnia and HerzegovinaBotswanaBrazilBrunei DarussalamBulgariaBurkina FasoBurundiCabo VerdeCambodiaCameroonCanadaCentral African RepublicChadChileChinaColombiaComorosCongo, Dem. Rep.Congo, Rep.Costa RicaCote d'IvoireCroatiaCubaCyprusCzech RepublicDenmarkDjiboutiDominicaDominican RepublicEcuadorEgypt, Arab Rep.El SalvadorEquatorial GuineaEritreaEstoniaEthiopiaFijiFinlandFranceGabonGambia, TheGeorgiaGermanyGhanaGreeceGrenadaGuatemalaGuineaGuinea-BissauGuyanaHaitiHondurasHong Kong SAR, ChinaHungaryIcelandIndiaIndonesiaIran, Islamic Rep.IraqIrelandIsraelItalyJamaicaJapanJordanKazakhstanKenyaKorea, Dem. People’s Rep.Korea, Rep.KuwaitKyrgyz RepublicLao PDRLatviaLebanonLesothoLiberiaLibyaLithuaniaLuxembourgMacao SAR, ChinaMacedonia, FYRMadagascarMalawiMalaysiaMaldivesMaliMaltaMauritaniaMauritiusMexicoMoldovaMonacoMongoliaMontenegroMoroccoMozambiqueMyanmarNamibiaNepalNetherlandsNew ZealandNicaraguaNigerNigeriaNorwayOmanPakistanPanamaPapua New GuineaParaguayPeruPhilippinesPolandPortugalPuerto RicoQatarRomaniaRussian FederationRwandaSan MarinoSao Tome and PrincipeSaudi ArabiaSenegalSerbiaSierra LeoneSingaporeSlovak RepublicSloveniaSolomon IslandsSomaliaSouth AfricaSpainSri LankaSt. Kitts and NevisSt. LuciaSt. Vincent and the GrenadinesSudanSurinameSwazilandSwedenSwitzerlandSyrian Arab RepublicTajikistanTanzaniaThailandTimor-LesteTogoTrinidad and TobagoTunisiaTurkeyTurkmenistanUgandaUkraineUnited Arab EmiratesUnited KingdomUnited StatesUruguayUzbekistanVanuatuVenezuela, RBVietnamWest Bank and GazaYemen, Rep.ZambiaZimbabwe Timeline:
This timeline shows a graph from 1991 to 2015 of South Africa. No data until 1990. Number of actual observations by date: 25.
Source name:
World Development Indicators
Source organization:
Data on health impacts from exposure to ambient PM2.5 pollution and household air pollution are from the Global Burden of Disease 2010 study. Data are provided by the Institute for Health Metrics and Evaluation at the University of Washington.
Categories, topics:
Economy & Growth, Environment
Last updated:
apr 23, 2017
Indicators value changes by year
Minimum:
1.299 bln
jan 1, 2015
Maximum:
2.496 bln
jan 1, 2006
At the date of observation
Value
Absolute change
Change from previous value
jan 1, 1991
1.654 bln
+1.654 bln
0.0%
jan 1, 1992
1.817 bln
+163.488 mln
9.88%
jan 1, 1993
2.019 bln
+201.979 mln
11.11%
jan 1, 1994
2.093 bln
+73.649 mln
3.65%
jan 1, 1995
2.142 bln
+48.66 mln
2.32%
jan 1, 1996
2.285 bln
+143.742 mln
6.71%
jan 1, 1997
2.117 bln
-168.351 mln
-7.37%
jan 1, 1998
2.187 bln
+69.894 mln
3.3%
jan 1, 1999
1.976 bln
-211.026 mln
-9.65%
jan 1, 2000
2.0 bln
+24.122 mln
1.22%
jan 1, 2001
2.005 bln
+5.103 mln
0.26%
jan 1, 2002
1.657 bln
-348.276 mln
-17.37%
jan 1, 2003
1.446 bln
-211.353 mln
-12.76%
jan 1, 2004
2.009 bln
+562.99 mln
38.95%
jan 1, 2005
2.417 bln
+408.152 mln
20.32%
jan 1, 2006
2.496 bln
+79.242 mln
3.28%
jan 1, 2007
2.368 bln
-128.115 mln
-5.13%
jan 1, 2008
2.37 bln
+1.699 mln
0.07%
jan 1, 2009
2.07 bln
-299.336 mln
-12.63%
jan 1, 2010
2.011 bln
-58.845 mln
-2.84%
jan 1, 2011
2.28 bln
+268.25 mln
13.34%
jan 1, 2012
2.278 bln
-1.655 mln
-0.07%
jan 1, 2013
1.968 bln
-309.658 mln
-13.59%
jan 1, 2014
1.608 bln
-360.738 mln
-18.33%
jan 1, 2015
1.299 bln
-308.363 mln
-19.18%
Ranking of countries by current statistics by years


Comments: