29
/
en
AIzaSyAYiBZKx7MnpbEhh9jyipgxe19OcubqV5w
April 1, 2024
281882
Vietnam
VNM
true
2
1
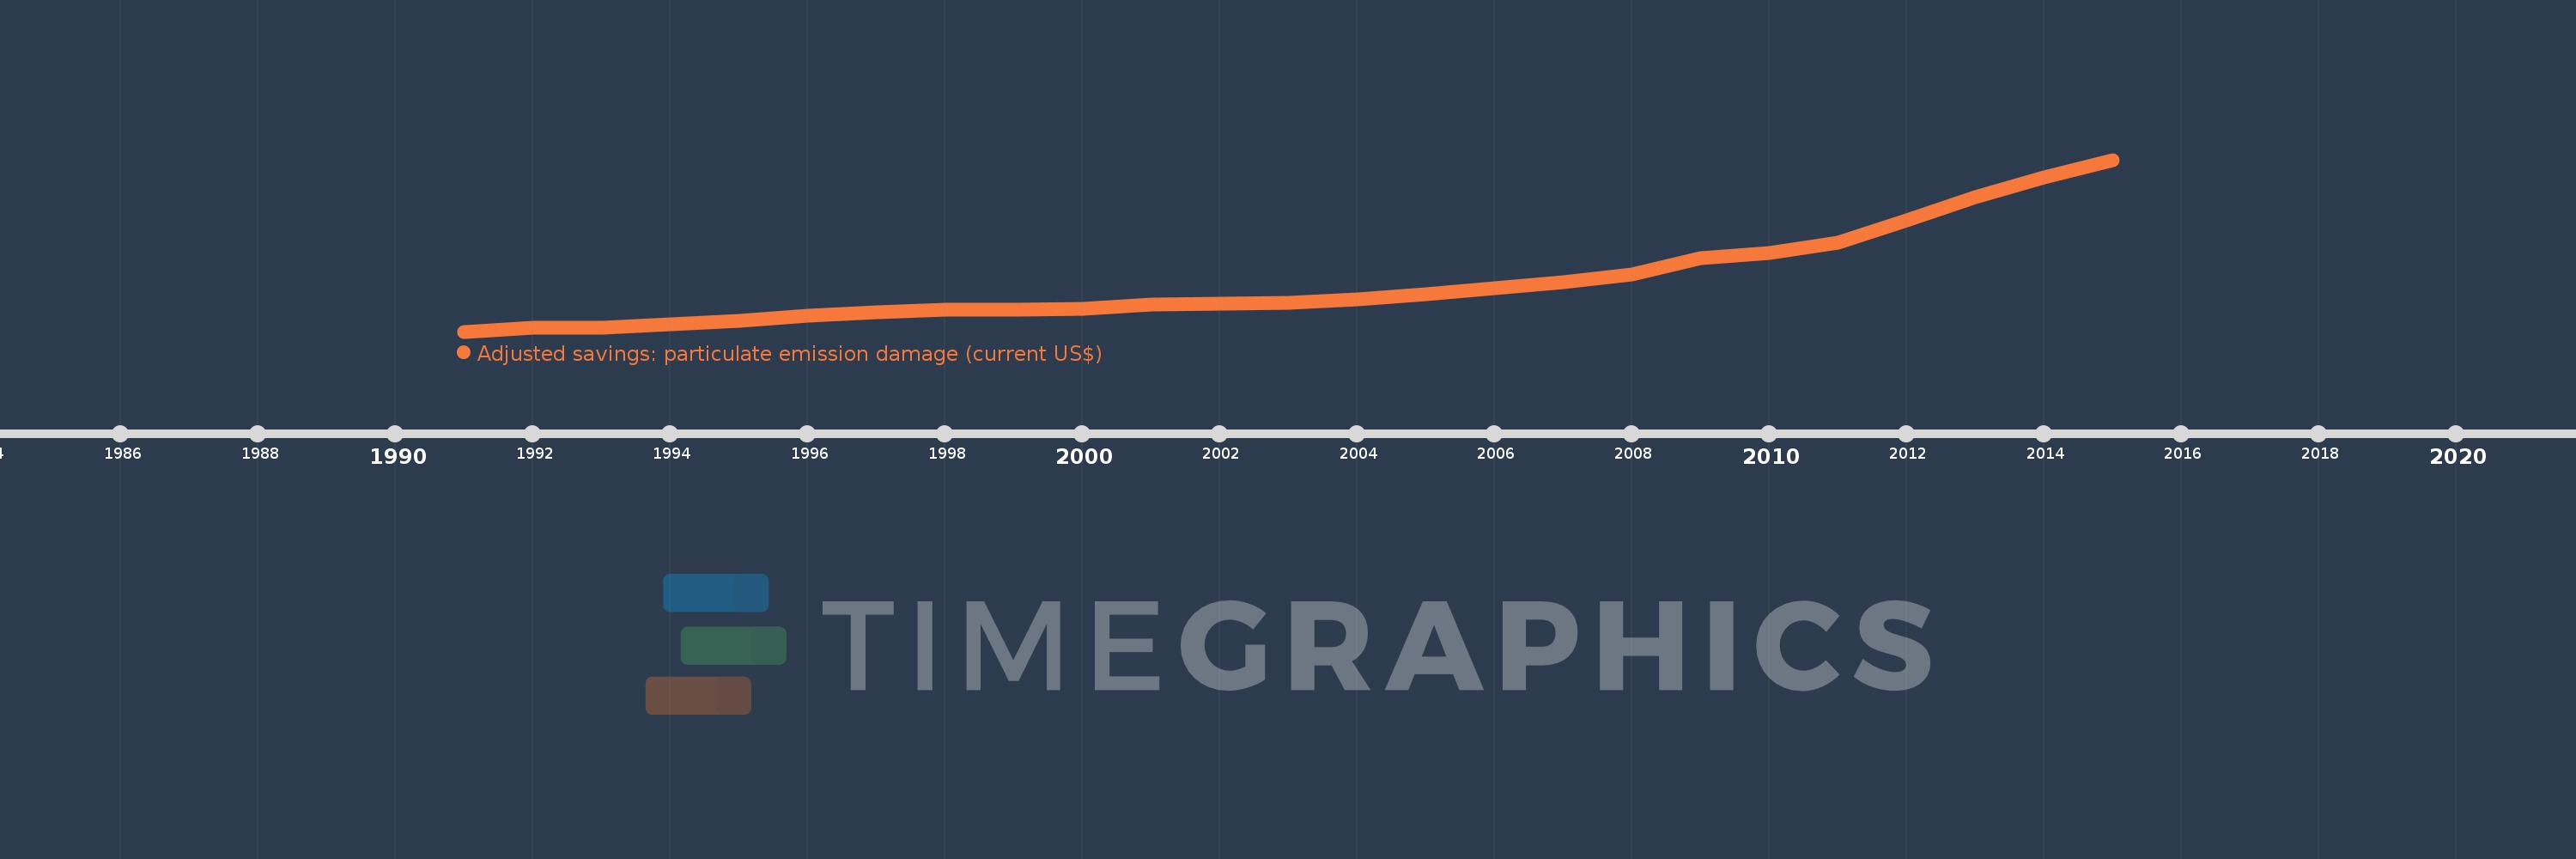
Adjusted savings: particulate emission damage (current US$)
2015,2014,2013,2012,2011,2010,2009,2008,2007,2006,2005,2004,2003,2002,2001,2000,1999,1998,1997,1996,1995,1994,1993,1992,1991
This statistics in other country:
AfghanistanAlbaniaAlgeriaAndorraAngolaAntigua and BarbudaArgentinaArmeniaAustraliaAustriaAzerbaijanBahamas, TheBahrainBangladeshBarbadosBelarusBelgiumBelizeBeninBhutanBoliviaBosnia and HerzegovinaBotswanaBrazilBrunei DarussalamBulgariaBurkina FasoBurundiCabo VerdeCambodiaCameroonCanadaCentral African RepublicChadChileChinaColombiaComorosCongo, Dem. Rep.Congo, Rep.Costa RicaCote d'IvoireCroatiaCubaCyprusCzech RepublicDenmarkDjiboutiDominicaDominican RepublicEcuadorEgypt, Arab Rep.El SalvadorEquatorial GuineaEritreaEstoniaEthiopiaFijiFinlandFranceGabonGambia, TheGeorgiaGermanyGhanaGreeceGrenadaGuatemalaGuineaGuinea-BissauGuyanaHaitiHondurasHong Kong SAR, ChinaHungaryIcelandIndiaIndonesiaIran, Islamic Rep.IraqIrelandIsraelItalyJamaicaJapanJordanKazakhstanKenyaKorea, Dem. People’s Rep.Korea, Rep.KuwaitKyrgyz RepublicLao PDRLatviaLebanonLesothoLiberiaLibyaLithuaniaLuxembourgMacao SAR, ChinaMacedonia, FYRMadagascarMalawiMalaysiaMaldivesMaliMaltaMauritaniaMauritiusMexicoMoldovaMonacoMongoliaMontenegroMoroccoMozambiqueMyanmarNamibiaNepalNetherlandsNew ZealandNicaraguaNigerNigeriaNorwayOmanPakistanPanamaPapua New GuineaParaguayPeruPhilippinesPolandPortugalPuerto RicoQatarRomaniaRussian FederationRwandaSan MarinoSao Tome and PrincipeSaudi ArabiaSenegalSerbiaSierra LeoneSingaporeSlovak RepublicSloveniaSolomon IslandsSomaliaSouth AfricaSpainSri LankaSt. Kitts and NevisSt. LuciaSt. Vincent and the GrenadinesSudanSurinameSwazilandSwedenSwitzerlandSyrian Arab RepublicTajikistanTanzaniaThailandTimor-LesteTogoTrinidad and TobagoTunisiaTurkeyTurkmenistanUgandaUkraineUnited Arab EmiratesUnited KingdomUnited StatesUruguayUzbekistanVanuatuVenezuela, RBVietnamWest Bank and GazaYemen, Rep.ZambiaZimbabwe Timeline:
This timeline shows a graph from 1991 to 2015 of Vietnam. No data until 1990. Number of actual observations by date: 25.
Source name:
World Development Indicators
Source organization:
Data on health impacts from exposure to ambient PM2.5 pollution and household air pollution are from the Global Burden of Disease 2010 study. Data are provided by the Institute for Health Metrics and Evaluation at the University of Washington.
Categories, topics:
Economy & Growth, Environment
Last updated:
apr 23, 2017
Indicators value changes by year
Minimum:
35.9 mln
jan 1, 1991
Maximum:
804.593 mln
jan 1, 2015
At the date of observation
Value
Absolute change
Change from previous value
jan 1, 1991
35.9 mln
+35.9 mln
0.0%
jan 1, 1992
53.659 mln
+17.759 mln
49.47%
jan 1, 1993
53.551 mln
-108.159K
-0.2%
jan 1, 1994
69.594 mln
+16.043 mln
29.96%
jan 1, 1995
82.797 mln
+13.203 mln
18.97%
jan 1, 1996
105.088 mln
+22.291 mln
26.92%
jan 1, 1997
123.159 mln
+18.072 mln
17.2%
jan 1, 1998
132.171 mln
+9.011 mln
7.32%
jan 1, 1999
132.995 mln
+824.831K
0.62%
jan 1, 2000
138.798 mln
+5.802 mln
4.36%
jan 1, 2001
157.299 mln
+18.502 mln
13.33%
jan 1, 2002
159.963 mln
+2.664 mln
1.69%
jan 1, 2003
165.947 mln
+5.984 mln
3.74%
jan 1, 2004
181.309 mln
+15.362 mln
9.26%
jan 1, 2005
202.997 mln
+21.688 mln
11.96%
jan 1, 2006
228.998 mln
+26.001 mln
12.81%
jan 1, 2007
255.96 mln
+26.962 mln
11.77%
jan 1, 2008
289.723 mln
+33.764 mln
13.19%
jan 1, 2009
364.688 mln
+74.965 mln
25.87%
jan 1, 2010
388.444 mln
+23.756 mln
6.51%
jan 1, 2011
434.689 mln
+46.245 mln
11.91%
jan 1, 2012
532.029 mln
+97.34 mln
22.39%
jan 1, 2013
638.088 mln
+106.058 mln
19.93%
jan 1, 2014
725.36 mln
+87.272 mln
13.68%
jan 1, 2015
804.593 mln
+79.234 mln
10.92%
Ranking of countries by current statistics by years


Comments: