29
/
en
AIzaSyAYiBZKx7MnpbEhh9jyipgxe19OcubqV5w
April 1, 2024
162164
Jamaica
JAM
true
2
1
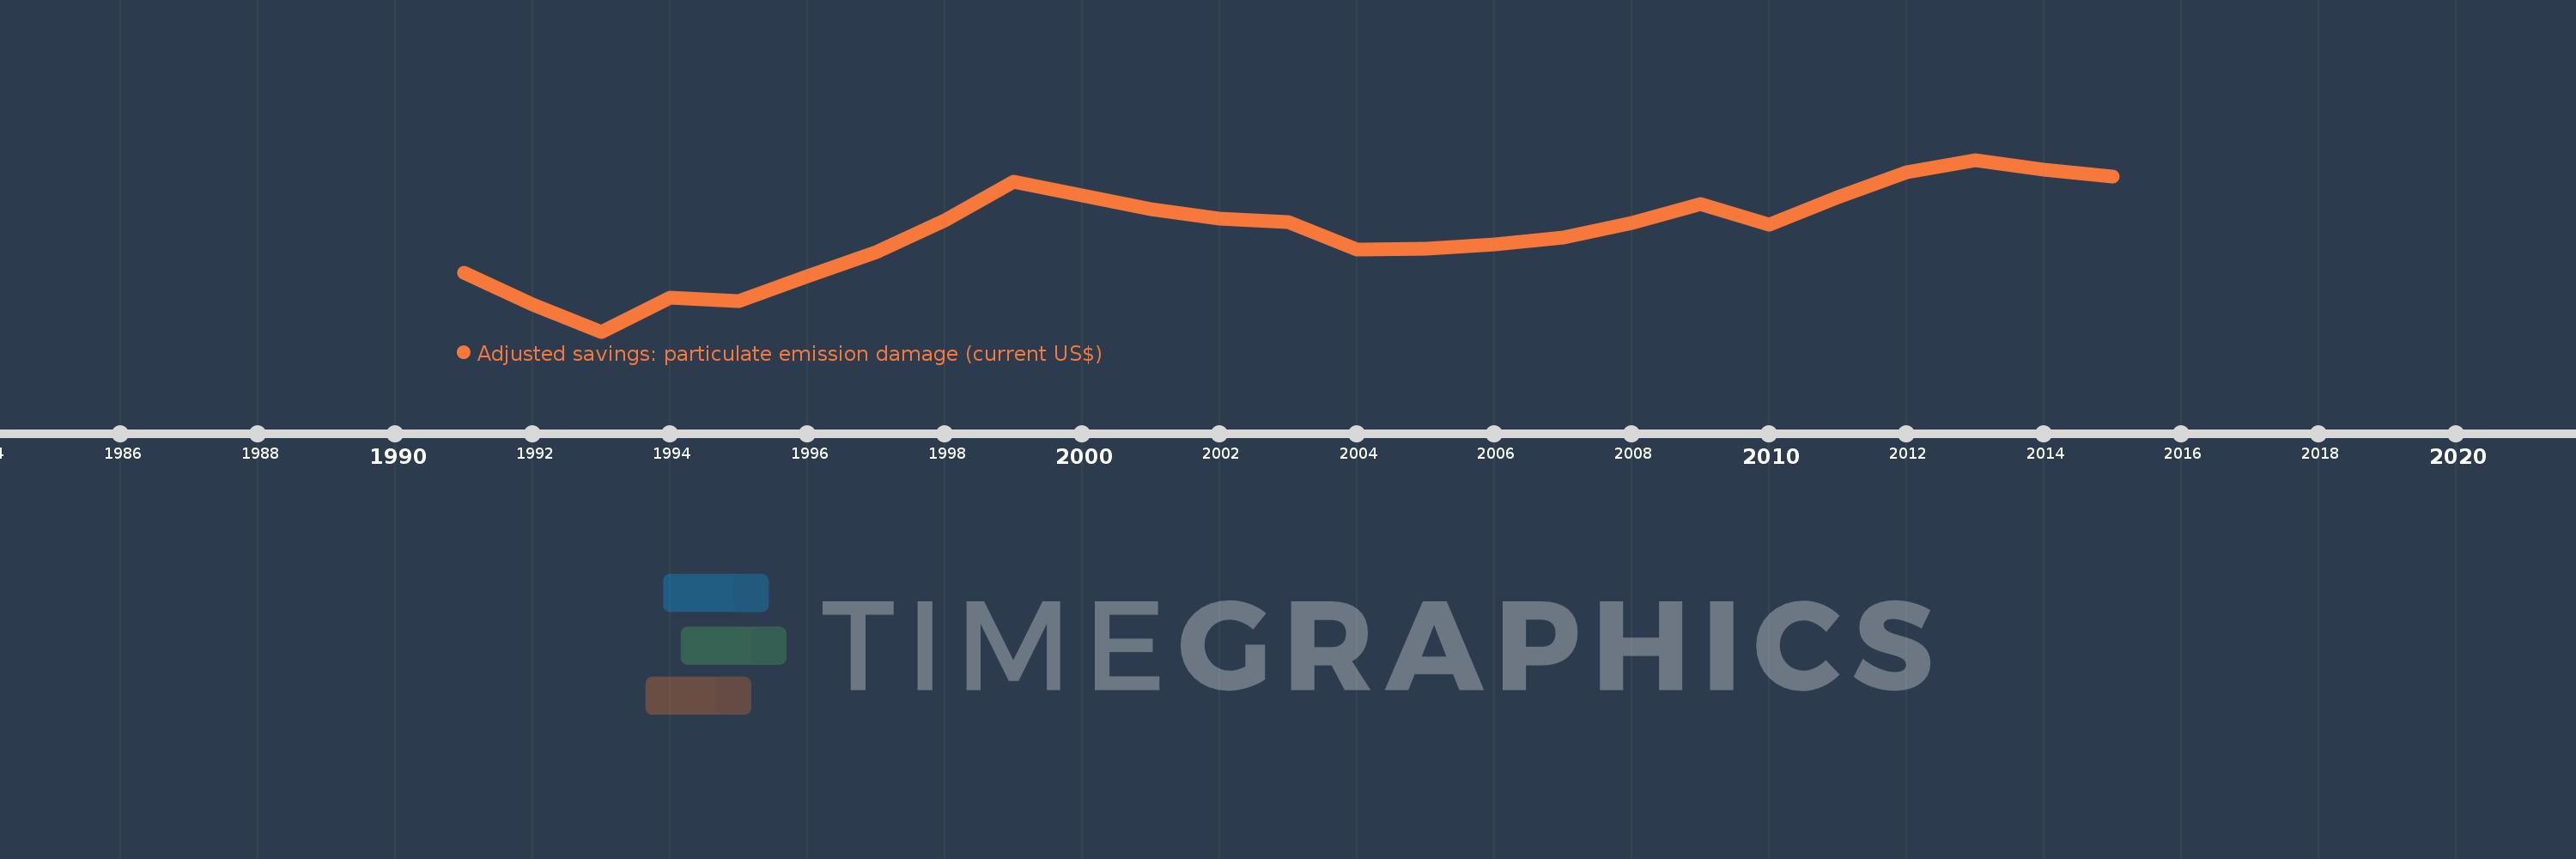
Adjusted savings: particulate emission damage (current US$)
2015,2014,2013,2012,2011,2010,2009,2008,2007,2006,2005,2004,2003,2002,2001,2000,1999,1998,1997,1996,1995,1994,1993,1992,1991
This statistics in other country:
AfghanistanAlbaniaAlgeriaAndorraAngolaAntigua and BarbudaArgentinaArmeniaAustraliaAustriaAzerbaijanBahamas, TheBahrainBangladeshBarbadosBelarusBelgiumBelizeBeninBhutanBoliviaBosnia and HerzegovinaBotswanaBrazilBrunei DarussalamBulgariaBurkina FasoBurundiCabo VerdeCambodiaCameroonCanadaCentral African RepublicChadChileChinaColombiaComorosCongo, Dem. Rep.Congo, Rep.Costa RicaCote d'IvoireCroatiaCubaCyprusCzech RepublicDenmarkDjiboutiDominicaDominican RepublicEcuadorEgypt, Arab Rep.El SalvadorEquatorial GuineaEritreaEstoniaEthiopiaFijiFinlandFranceGabonGambia, TheGeorgiaGermanyGhanaGreeceGrenadaGuatemalaGuineaGuinea-BissauGuyanaHaitiHondurasHong Kong SAR, ChinaHungaryIcelandIndiaIndonesiaIran, Islamic Rep.IraqIrelandIsraelItalyJamaicaJapanJordanKazakhstanKenyaKorea, Dem. People’s Rep.Korea, Rep.KuwaitKyrgyz RepublicLao PDRLatviaLebanonLesothoLiberiaLibyaLithuaniaLuxembourgMacao SAR, ChinaMacedonia, FYRMadagascarMalawiMalaysiaMaldivesMaliMaltaMauritaniaMauritiusMexicoMoldovaMonacoMongoliaMontenegroMoroccoMozambiqueMyanmarNamibiaNepalNetherlandsNew ZealandNicaraguaNigerNigeriaNorwayOmanPakistanPanamaPapua New GuineaParaguayPeruPhilippinesPolandPortugalPuerto RicoQatarRomaniaRussian FederationRwandaSan MarinoSao Tome and PrincipeSaudi ArabiaSenegalSerbiaSierra LeoneSingaporeSlovak RepublicSloveniaSolomon IslandsSomaliaSouth AfricaSpainSri LankaSt. Kitts and NevisSt. LuciaSt. Vincent and the GrenadinesSudanSurinameSwazilandSwedenSwitzerlandSyrian Arab RepublicTajikistanTanzaniaThailandTimor-LesteTogoTrinidad and TobagoTunisiaTurkeyTurkmenistanUgandaUkraineUnited Arab EmiratesUnited KingdomUnited StatesUruguayUzbekistanVanuatuVenezuela, RBVietnamWest Bank and GazaYemen, Rep.ZambiaZimbabwe Timeline:
This timeline shows a graph from 1991 to 2015 of Jamaica. No data until 1990. Number of actual observations by date: 25.
Source name:
World Development Indicators
Source organization:
Data on health impacts from exposure to ambient PM2.5 pollution and household air pollution are from the Global Burden of Disease 2010 study. Data are provided by the Institute for Health Metrics and Evaluation at the University of Washington.
Categories, topics:
Economy & Growth, Environment
Last updated:
apr 23, 2017
Indicators value changes by year
Minimum:
11.609 mln
jan 1, 1993
Maximum:
26.524 mln
jan 1, 2013
At the date of observation
Value
Absolute change
Change from previous value
jan 1, 1991
16.713 mln
+16.713 mln
0.0%
jan 1, 1992
13.96 mln
-2.753 mln
-16.47%
jan 1, 1993
11.609 mln
-2.351 mln
-16.84%
jan 1, 1994
14.554 mln
+2.945 mln
25.37%
jan 1, 1995
14.236 mln
-318.681K
-2.19%
jan 1, 1996
16.401 mln
+2.166 mln
15.21%
jan 1, 1997
18.493 mln
+2.091 mln
12.75%
jan 1, 1998
21.263 mln
+2.77 mln
14.98%
jan 1, 1999
24.627 mln
+3.364 mln
15.82%
jan 1, 2000
23.463 mln
-1.164 mln
-4.73%
jan 1, 2001
22.263 mln
-1.2 mln
-5.11%
jan 1, 2002
21.403 mln
-859.323K
-3.86%
jan 1, 2003
21.152 mln
-251.694K
-1.18%
jan 1, 2004
18.726 mln
-2.426 mln
-11.47%
jan 1, 2005
18.797 mln
+71.113K
0.38%
jan 1, 2006
19.193 mln
+396.003K
2.11%
jan 1, 2007
19.764 mln
+571.336K
2.98%
jan 1, 2008
21.033 mln
+1.269 mln
6.42%
jan 1, 2009
22.66 mln
+1.627 mln
7.74%
jan 1, 2010
20.896 mln
-1.765 mln
-7.79%
jan 1, 2011
23.277 mln
+2.382 mln
11.4%
jan 1, 2012
25.414 mln
+2.137 mln
9.18%
jan 1, 2013
26.524 mln
+1.11 mln
4.37%
jan 1, 2014
25.634 mln
-889.869K
-3.35%
jan 1, 2015
25.081 mln
-553.167K
-2.16%
Ranking of countries by current statistics by years


Comments: