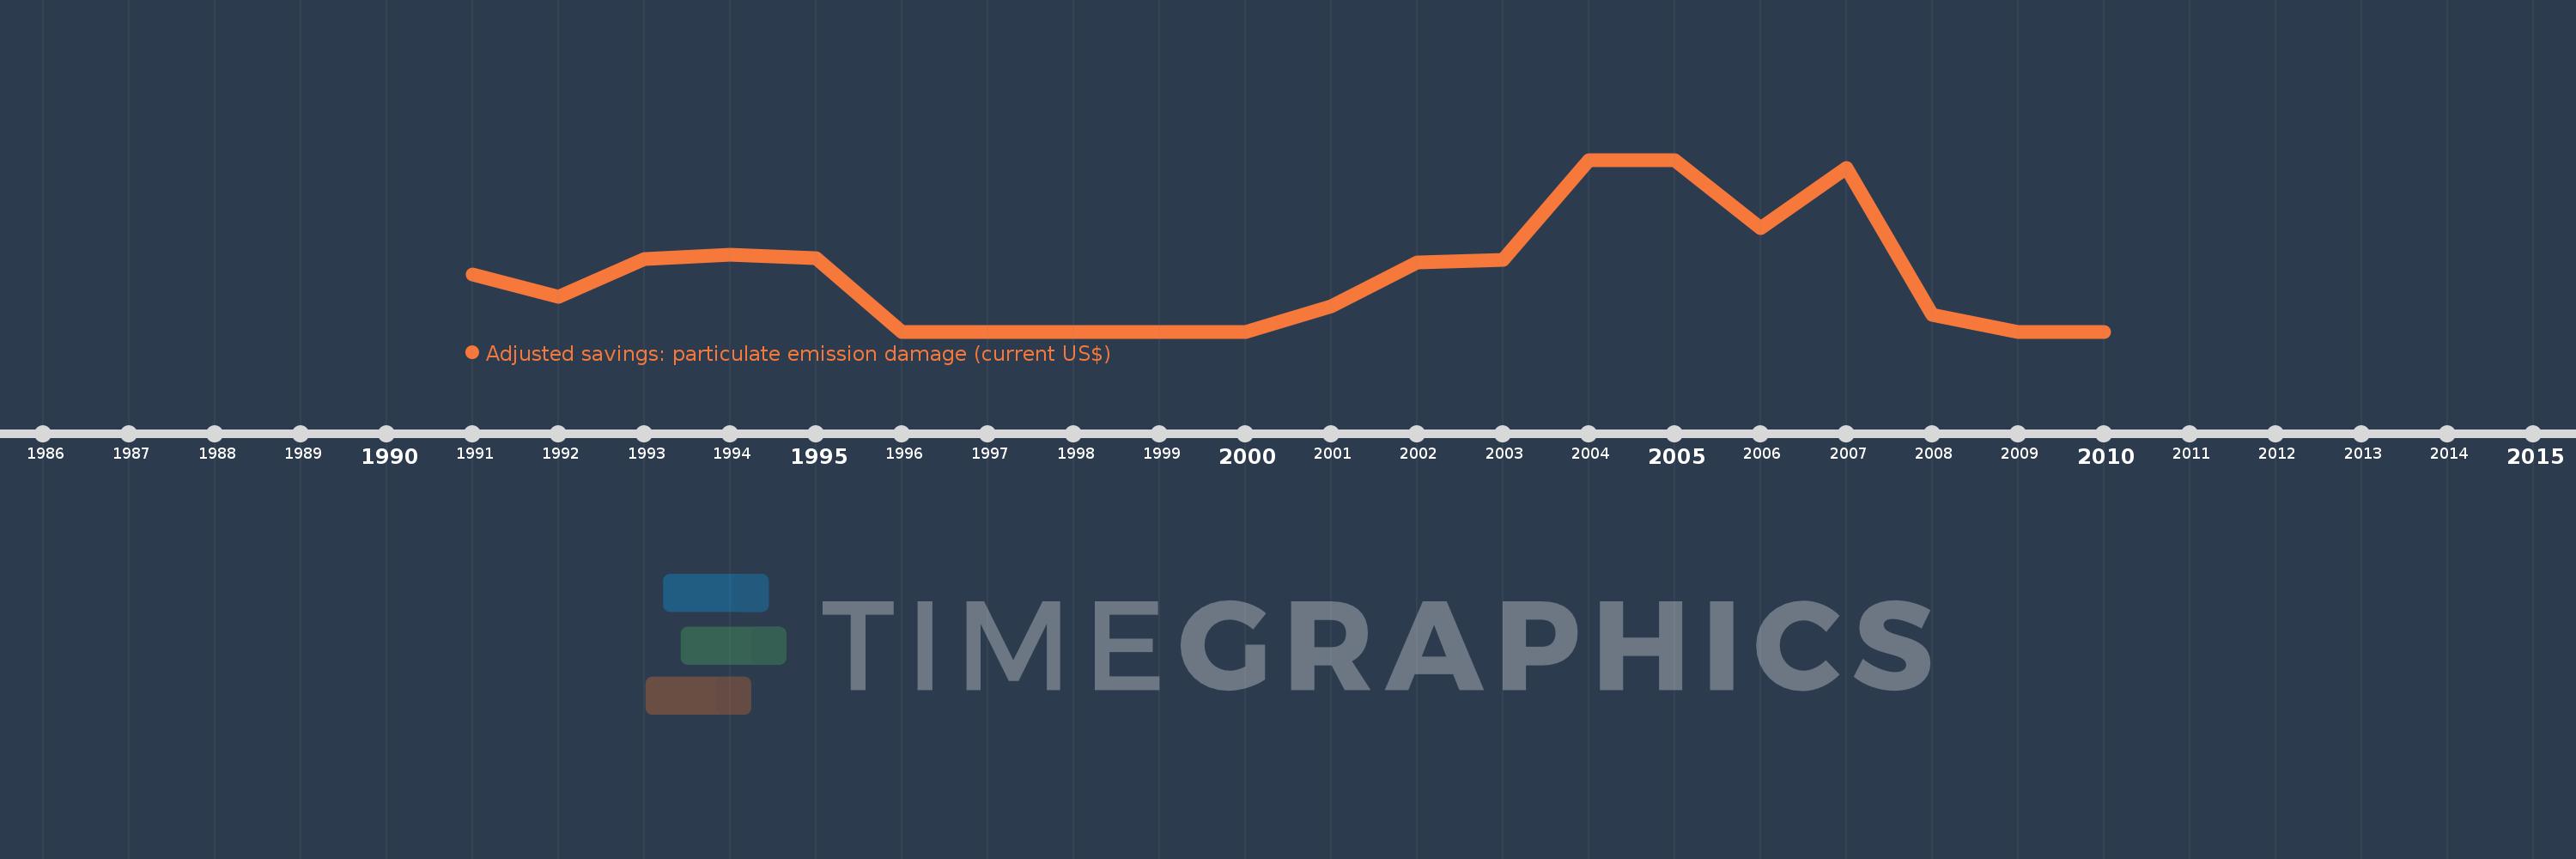
This timeline shows a graph from 1991 to 2010 of Sao Tome and Principe. No data until 1990. Number of actual observations by date: 20.
Source name:
World Development Indicators
Source organization:
Data on health impacts from exposure to ambient PM2.5 pollution and household air pollution are from the Global Burden of Disease 2010 study. Data are provided by the Institute for Health Metrics and Evaluation at the University of Washington.
Categories, topics:
Economy & Growth, Environment
Last updated:
apr 23, 2017
Indicators value changes by year
Meaning:
4.106K
Minimum:
0.0
jan 1, 1996
Maximum:
12.723K
jan 1, 2004
At the date of observation
Value
Absolute change
Change from the previous value
jan 1, 1991
4.209K
+4.209K
0.0%
jan 1, 1992
2.586K
-1.622K
-38.55%
jan 1, 1993
5.391K
+2.805K
108.44%
jan 1, 1994
5.698K
+307.562
5.71%
jan 1, 1995
5.42K
-278.382
-4.89%
jan 1, 1996
0.0
-5.42K
-100.0%
jan 1, 1997
0.0
0.0
%
jan 1, 1998
0.0
0.0
%
jan 1, 1999
0.0
0.0
%
jan 1, 2000
0.0
0.0
%
jan 1, 2001
1.901K
+1.901K
%
jan 1, 2002
5.13K
+3.229K
169.83%
jan 1, 2003
5.329K
+198.372
3.87%
jan 1, 2004
12.723K
+7.394K
138.76%
jan 1, 2005
12.677K
-45.793
-0.36%
jan 1, 2006
7.692K
-4.986K
-39.33%
jan 1, 2007
12.118K
+4.427K
57.55%
jan 1, 2008
1.246K
-10.872K
-89.72%
jan 1, 2009
0.0
-1.246K
-100.0%
jan 1, 2010
0.0
0.0
%
Ranking of countries by current statistics by years
