29
/
en
AIzaSyAYiBZKx7MnpbEhh9jyipgxe19OcubqV5w
April 1, 2024
279479
Vanuatu
VUT
true
2
1
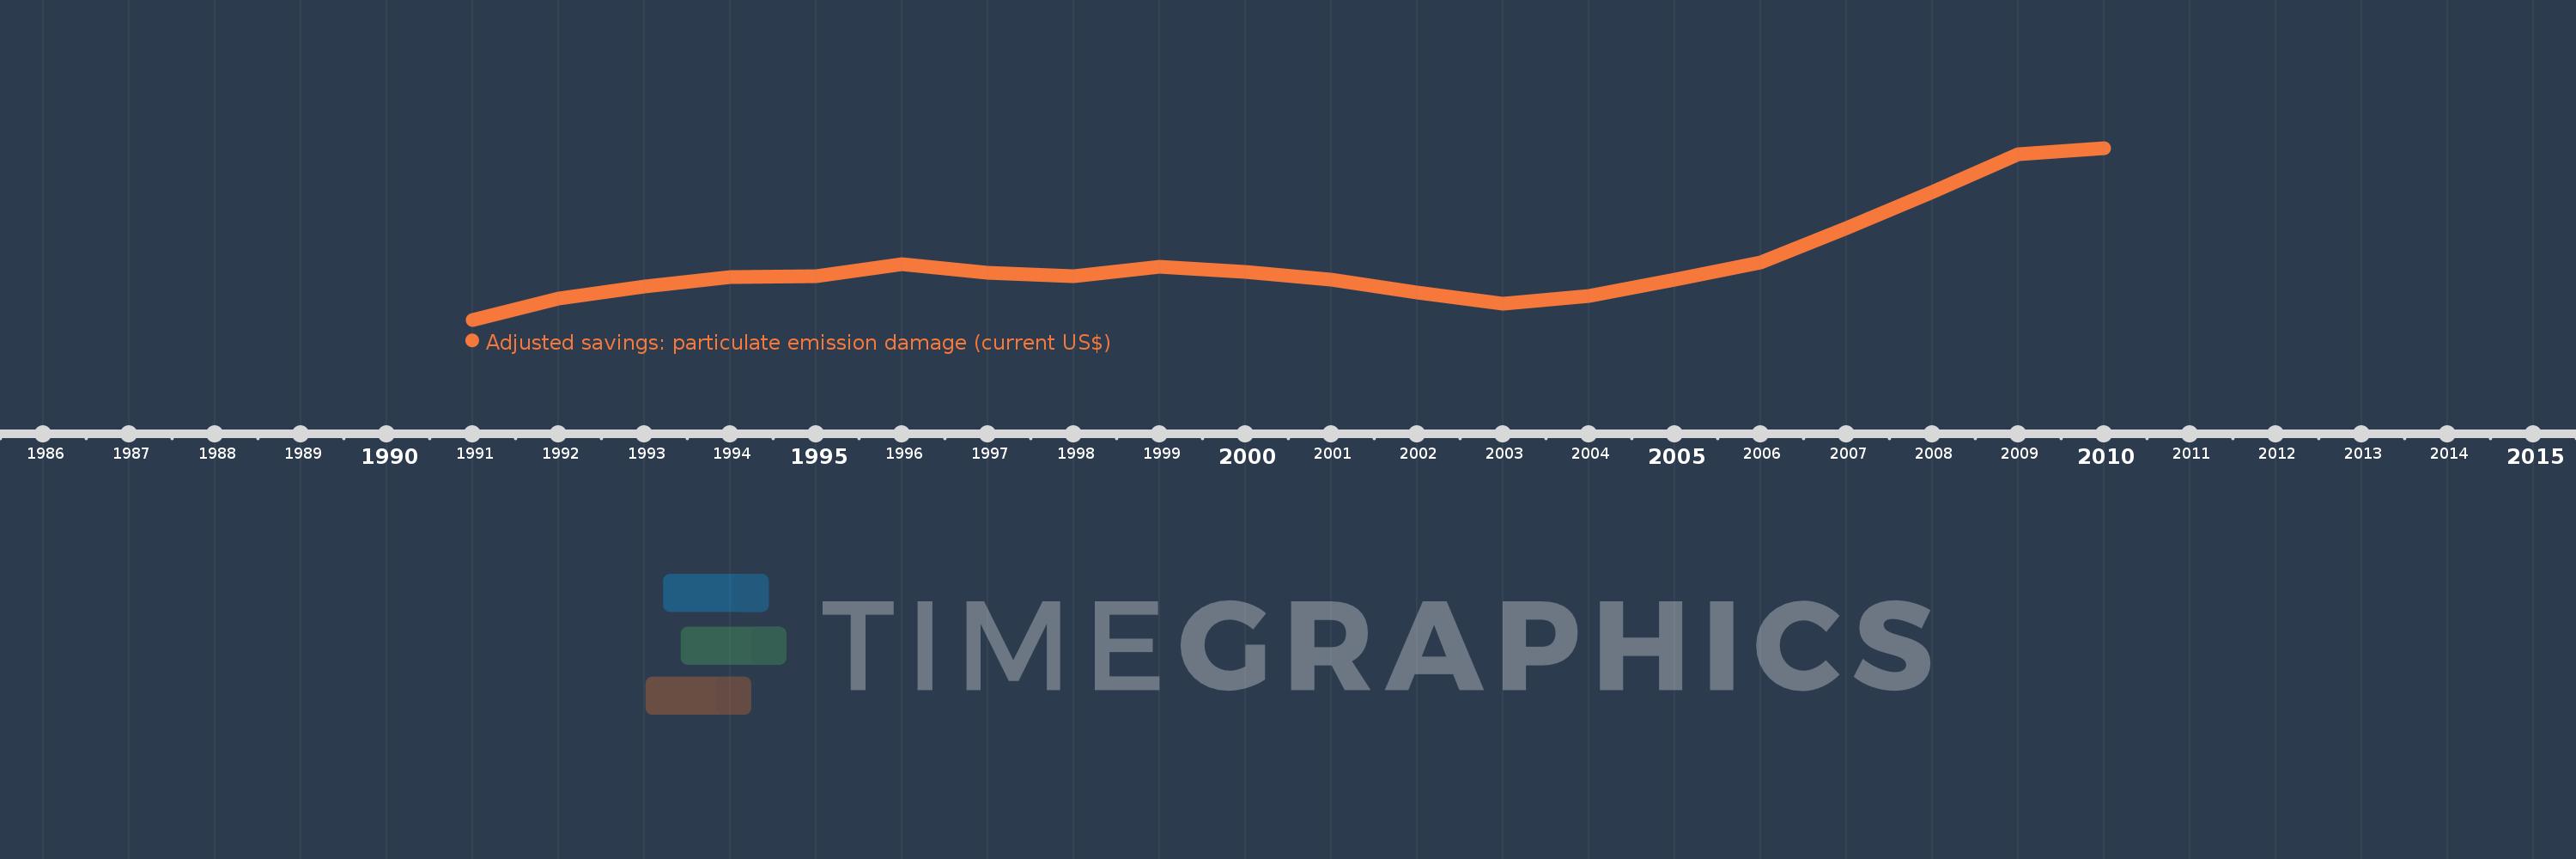
Adjusted savings: particulate emission damage (current US$)
2010,2009,2008,2007,2006,2005,2004,2003,2002,2001,2000,1999,1998,1997,1996,1995,1994,1993,1992,1991
This statistics in other country:
AfghanistanAlbaniaAlgeriaAndorraAngolaAntigua and BarbudaArgentinaArmeniaAustraliaAustriaAzerbaijanBahamas, TheBahrainBangladeshBarbadosBelarusBelgiumBelizeBeninBhutanBoliviaBosnia and HerzegovinaBotswanaBrazilBrunei DarussalamBulgariaBurkina FasoBurundiCabo VerdeCambodiaCameroonCanadaCentral African RepublicChadChileChinaColombiaComorosCongo, Dem. Rep.Congo, Rep.Costa RicaCote d'IvoireCroatiaCubaCyprusCzech RepublicDenmarkDjiboutiDominicaDominican RepublicEcuadorEgypt, Arab Rep.El SalvadorEquatorial GuineaEritreaEstoniaEthiopiaFijiFinlandFranceGabonGambia, TheGeorgiaGermanyGhanaGreeceGrenadaGuatemalaGuineaGuinea-BissauGuyanaHaitiHondurasHong Kong SAR, ChinaHungaryIcelandIndiaIndonesiaIran, Islamic Rep.IraqIrelandIsraelItalyJamaicaJapanJordanKazakhstanKenyaKorea, Dem. People’s Rep.Korea, Rep.KuwaitKyrgyz RepublicLao PDRLatviaLebanonLesothoLiberiaLibyaLithuaniaLuxembourgMacao SAR, ChinaMacedonia, FYRMadagascarMalawiMalaysiaMaldivesMaliMaltaMauritaniaMauritiusMexicoMoldovaMonacoMongoliaMontenegroMoroccoMozambiqueMyanmarNamibiaNepalNetherlandsNew ZealandNicaraguaNigerNigeriaNorwayOmanPakistanPanamaPapua New GuineaParaguayPeruPhilippinesPolandPortugalPuerto RicoQatarRomaniaRussian FederationRwandaSan MarinoSao Tome and PrincipeSaudi ArabiaSenegalSerbiaSierra LeoneSingaporeSlovak RepublicSloveniaSolomon IslandsSomaliaSouth AfricaSpainSri LankaSt. Kitts and NevisSt. LuciaSt. Vincent and the GrenadinesSudanSurinameSwazilandSwedenSwitzerlandSyrian Arab RepublicTajikistanTanzaniaThailandTimor-LesteTogoTrinidad and TobagoTunisiaTurkeyTurkmenistanUgandaUkraineUnited Arab EmiratesUnited KingdomUnited StatesUruguayUzbekistanVanuatuVenezuela, RBVietnamWest Bank and GazaYemen, Rep.ZambiaZimbabwe Timeline:
This timeline shows a graph from 1991 to 2010 of Vanuatu. No data until 1990. Number of actual observations by date: 20.
Source name:
World Development Indicators
Source organization:
Data on health impacts from exposure to ambient PM2.5 pollution and household air pollution are from the Global Burden of Disease 2010 study. Data are provided by the Institute for Health Metrics and Evaluation at the University of Washington.
Categories, topics:
Economy & Growth, Environment
Last updated:
apr 23, 2017
Indicators value changes by year
Minimum:
201.702K
jan 1, 1991
Maximum:
518.176K
jan 1, 2010
At the date of observation
Value
Absolute change
Change from previous value
jan 1, 1991
201.702K
+201.702K
0.0%
jan 1, 1992
241.166K
+39.464K
19.57%
jan 1, 1993
263.495K
+22.328K
9.26%
jan 1, 1994
280.432K
+16.937K
6.43%
jan 1, 1995
281.994K
+1.562K
0.56%
jan 1, 1996
304.755K
+22.761K
8.07%
jan 1, 1997
287.927K
-16.828K
-5.52%
jan 1, 1998
282.425K
-5.502K
-1.91%
jan 1, 1999
299.197K
+16.772K
5.94%
jan 1, 2000
290.264K
-8.932K
-2.99%
jan 1, 2001
275.657K
-14.607K
-5.03%
jan 1, 2002
252.482K
-23.175K
-8.41%
jan 1, 2003
230.784K
-21.698K
-8.59%
jan 1, 2004
245.885K
+15.101K
6.54%
jan 1, 2005
276.313K
+30.428K
12.37%
jan 1, 2006
307.065K
+30.752K
11.13%
jan 1, 2007
370.324K
+63.259K
20.6%
jan 1, 2008
436.805K
+66.481K
17.95%
jan 1, 2009
506.286K
+69.481K
15.91%
jan 1, 2010
518.176K
+11.891K
2.35%
Ranking of countries by current statistics by years


Comments: