29
/
en
AIzaSyAYiBZKx7MnpbEhh9jyipgxe19OcubqV5w
April 1, 2024
230637
Rwanda
RWA
true
2
1
Adjusted savings: particulate emission damage (current US$)
2015,2014,2013,2012,2011,2010,2009,2008,2007,2006,2005,2004,2003,2002,2001,2000,1999,1998,1997,1996,1995,1994,1993,1992,1991
This statistics in other country:
AfghanistanAlbaniaAlgeriaAndorraAngolaAntigua and BarbudaArgentinaArmeniaAustraliaAustriaAzerbaijanBahamas, TheBahrainBangladeshBarbadosBelarusBelgiumBelizeBeninBhutanBoliviaBosnia and HerzegovinaBotswanaBrazilBrunei DarussalamBulgariaBurkina FasoBurundiCabo VerdeCambodiaCameroonCanadaCentral African RepublicChadChileChinaColombiaComorosCongo, Dem. Rep.Congo, Rep.Costa RicaCote d'IvoireCroatiaCubaCyprusCzech RepublicDenmarkDjiboutiDominicaDominican RepublicEcuadorEgypt, Arab Rep.El SalvadorEquatorial GuineaEritreaEstoniaEthiopiaFijiFinlandFranceGabonGambia, TheGeorgiaGermanyGhanaGreeceGrenadaGuatemalaGuineaGuinea-BissauGuyanaHaitiHondurasHong Kong SAR, ChinaHungaryIcelandIndiaIndonesiaIran, Islamic Rep.IraqIrelandIsraelItalyJamaicaJapanJordanKazakhstanKenyaKorea, Dem. People’s Rep.Korea, Rep.KuwaitKyrgyz RepublicLao PDRLatviaLebanonLesothoLiberiaLibyaLithuaniaLuxembourgMacao SAR, ChinaMacedonia, FYRMadagascarMalawiMalaysiaMaldivesMaliMaltaMauritaniaMauritiusMexicoMoldovaMonacoMongoliaMontenegroMoroccoMozambiqueMyanmarNamibiaNepalNetherlandsNew ZealandNicaraguaNigerNigeriaNorwayOmanPakistanPanamaPapua New GuineaParaguayPeruPhilippinesPolandPortugalPuerto RicoQatarRomaniaRussian FederationRwandaSan MarinoSao Tome and PrincipeSaudi ArabiaSenegalSerbiaSierra LeoneSingaporeSlovak RepublicSloveniaSolomon IslandsSomaliaSouth AfricaSpainSri LankaSt. Kitts and NevisSt. LuciaSt. Vincent and the GrenadinesSudanSurinameSwazilandSwedenSwitzerlandSyrian Arab RepublicTajikistanTanzaniaThailandTimor-LesteTogoTrinidad and TobagoTunisiaTurkeyTurkmenistanUgandaUkraineUnited Arab EmiratesUnited KingdomUnited StatesUruguayUzbekistanVanuatuVenezuela, RBVietnamWest Bank and GazaYemen, Rep.ZambiaZimbabwe Timeline:
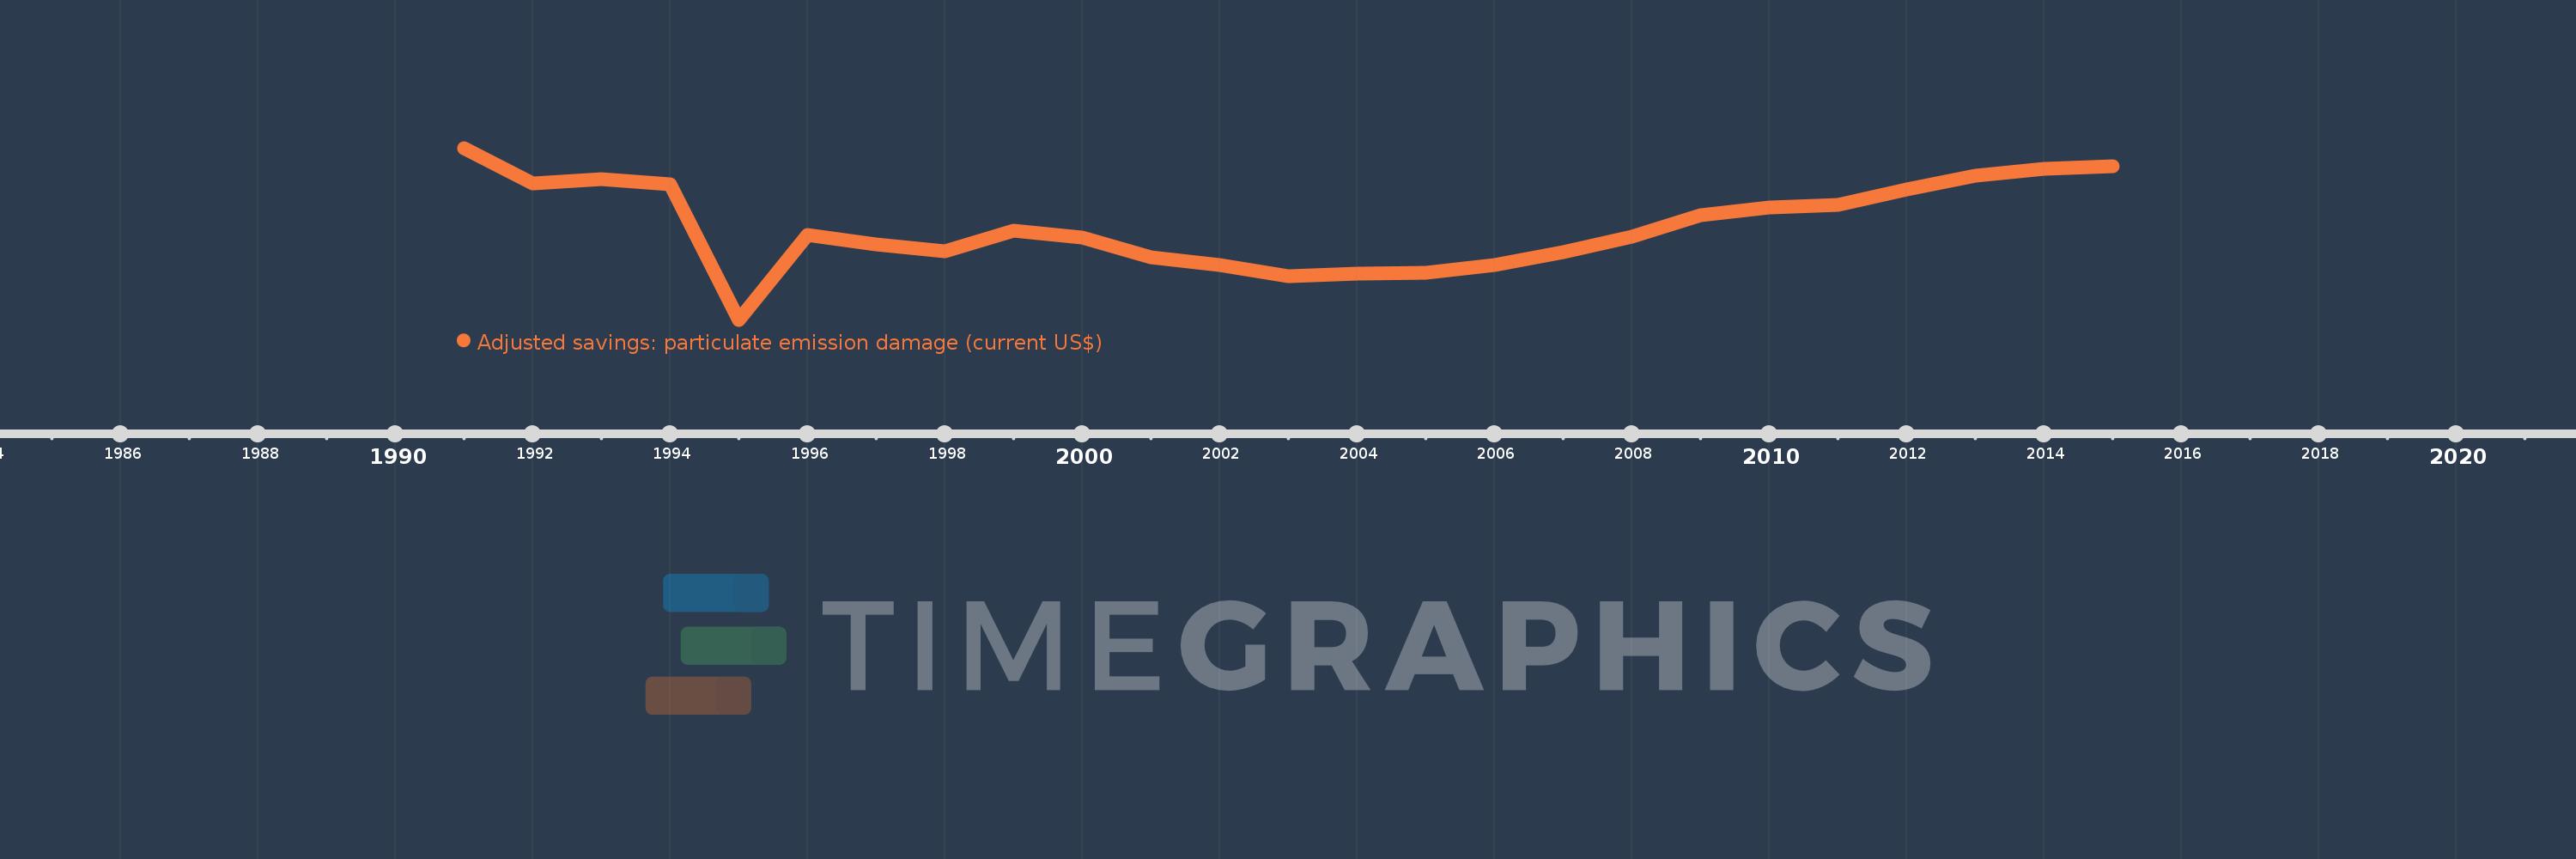
This timeline shows a graph from 1991 to 2015 of Rwanda. No data until 1990. Number of actual observations by date: 25.
Source name:
World Development Indicators
Source organization:
Data on health impacts from exposure to ambient PM2.5 pollution and household air pollution are from the Global Burden of Disease 2010 study. Data are provided by the Institute for Health Metrics and Evaluation at the University of Washington.
Categories, topics:
Economy & Growth, Environment
Last updated:
apr 23, 2017
Indicators value changes by year
Minimum:
12.185 mln
jan 1, 1995
Maximum:
76.673 mln
jan 1, 1991
At the date of observation
Value
Absolute change
Change from previous value
jan 1, 1991
76.673 mln
+76.673 mln
0.0%
jan 1, 1992
63.383 mln
-13.29 mln
-17.33%
jan 1, 1993
65.066 mln
+1.682 mln
2.65%
jan 1, 1994
63.1 mln
-1.966 mln
-3.02%
jan 1, 1995
12.185 mln
-50.914 mln
-80.69%
jan 1, 1996
43.908 mln
+31.723 mln
260.33%
jan 1, 1997
40.555 mln
-3.353 mln
-7.64%
jan 1, 1998
37.94 mln
-2.615 mln
-6.45%
jan 1, 1999
45.714 mln
+7.774 mln
20.49%
jan 1, 2000
43.202 mln
-2.512 mln
-5.49%
jan 1, 2001
35.549 mln
-7.653 mln
-17.71%
jan 1, 2002
32.581 mln
-2.968 mln
-8.35%
jan 1, 2003
28.546 mln
-4.034 mln
-12.38%
jan 1, 2004
29.569 mln
+1.022 mln
3.58%
jan 1, 2005
29.67 mln
+101.755K
0.34%
jan 1, 2006
32.728 mln
+3.058 mln
10.31%
jan 1, 2007
37.471 mln
+4.743 mln
14.49%
jan 1, 2008
43.264 mln
+5.792 mln
15.46%
jan 1, 2009
51.384 mln
+8.12 mln
18.77%
jan 1, 2010
54.42 mln
+3.036 mln
5.91%
jan 1, 2011
55.306 mln
+886.27K
1.63%
jan 1, 2012
60.992 mln
+5.686 mln
10.28%
jan 1, 2013
66.346 mln
+5.354 mln
8.78%
jan 1, 2014
68.78 mln
+2.434 mln
3.67%
jan 1, 2015
69.965 mln
+1.185 mln
1.72%
Ranking of countries by current statistics by years


Comments: