29
/
en
AIzaSyAYiBZKx7MnpbEhh9jyipgxe19OcubqV5w
April 1, 2024
234368
Saudi Arabia
SAU
true
2
1
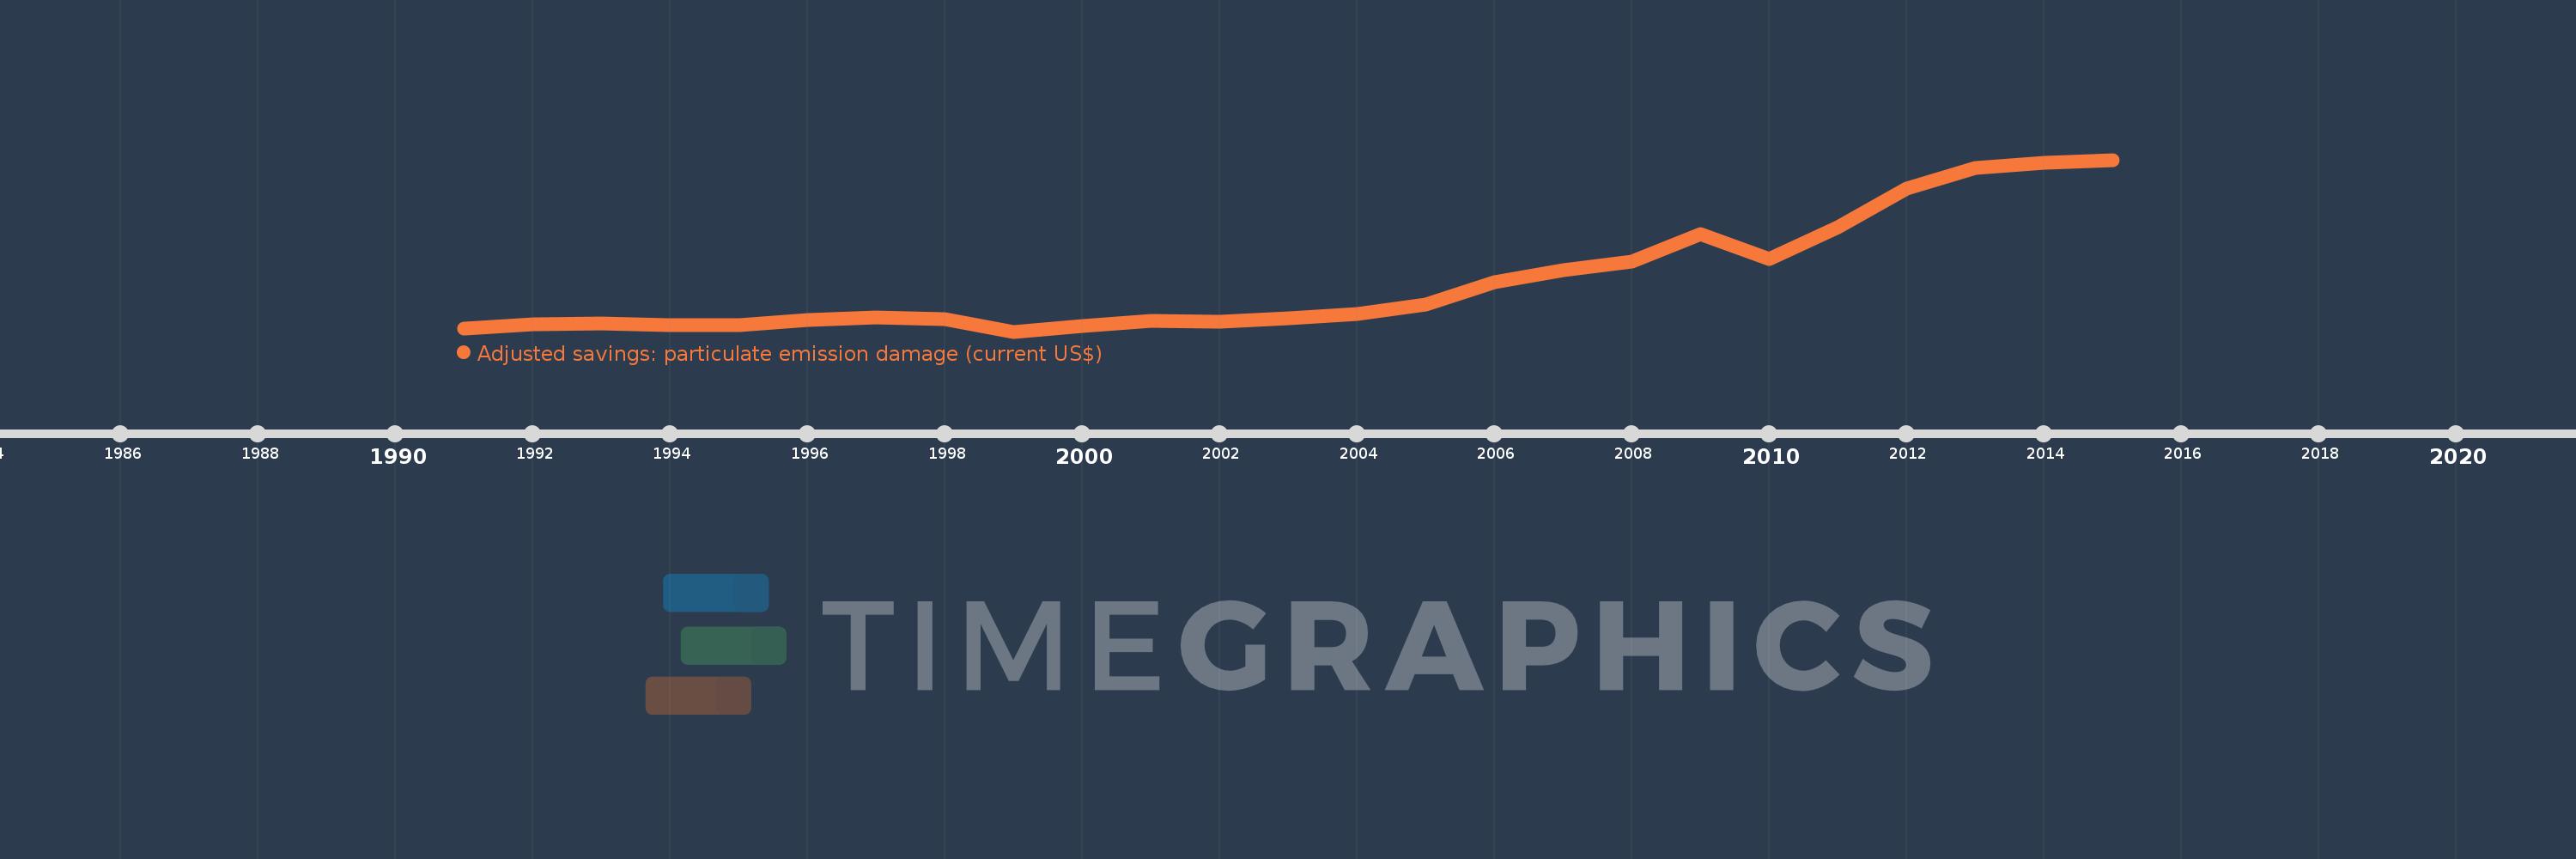
Adjusted savings: particulate emission damage (current US$)
2015,2014,2013,2012,2011,2010,2009,2008,2007,2006,2005,2004,2003,2002,2001,2000,1999,1998,1997,1996,1995,1994,1993,1992,1991
This statistics in other country:
AfghanistanAlbaniaAlgeriaAndorraAngolaAntigua and BarbudaArgentinaArmeniaAustraliaAustriaAzerbaijanBahamas, TheBahrainBangladeshBarbadosBelarusBelgiumBelizeBeninBhutanBoliviaBosnia and HerzegovinaBotswanaBrazilBrunei DarussalamBulgariaBurkina FasoBurundiCabo VerdeCambodiaCameroonCanadaCentral African RepublicChadChileChinaColombiaComorosCongo, Dem. Rep.Congo, Rep.Costa RicaCote d'IvoireCroatiaCubaCyprusCzech RepublicDenmarkDjiboutiDominicaDominican RepublicEcuadorEgypt, Arab Rep.El SalvadorEquatorial GuineaEritreaEstoniaEthiopiaFijiFinlandFranceGabonGambia, TheGeorgiaGermanyGhanaGreeceGrenadaGuatemalaGuineaGuinea-BissauGuyanaHaitiHondurasHong Kong SAR, ChinaHungaryIcelandIndiaIndonesiaIran, Islamic Rep.IraqIrelandIsraelItalyJamaicaJapanJordanKazakhstanKenyaKorea, Dem. People’s Rep.Korea, Rep.KuwaitKyrgyz RepublicLao PDRLatviaLebanonLesothoLiberiaLibyaLithuaniaLuxembourgMacao SAR, ChinaMacedonia, FYRMadagascarMalawiMalaysiaMaldivesMaliMaltaMauritaniaMauritiusMexicoMoldovaMonacoMongoliaMontenegroMoroccoMozambiqueMyanmarNamibiaNepalNetherlandsNew ZealandNicaraguaNigerNigeriaNorwayOmanPakistanPanamaPapua New GuineaParaguayPeruPhilippinesPolandPortugalPuerto RicoQatarRomaniaRussian FederationRwandaSan MarinoSao Tome and PrincipeSaudi ArabiaSenegalSerbiaSierra LeoneSingaporeSlovak RepublicSloveniaSolomon IslandsSomaliaSouth AfricaSpainSri LankaSt. Kitts and NevisSt. LuciaSt. Vincent and the GrenadinesSudanSurinameSwazilandSwedenSwitzerlandSyrian Arab RepublicTajikistanTanzaniaThailandTimor-LesteTogoTrinidad and TobagoTunisiaTurkeyTurkmenistanUgandaUkraineUnited Arab EmiratesUnited KingdomUnited StatesUruguayUzbekistanVanuatuVenezuela, RBVietnamWest Bank and GazaYemen, Rep.ZambiaZimbabwe Timeline:
This timeline shows a graph from 1991 to 2015 of Saudi Arabia. No data until 1990. Number of actual observations by date: 25.
Source name:
World Development Indicators
Source organization:
Data on health impacts from exposure to ambient PM2.5 pollution and household air pollution are from the Global Burden of Disease 2010 study. Data are provided by the Institute for Health Metrics and Evaluation at the University of Washington.
Categories, topics:
Economy & Growth, Environment
Last updated:
apr 23, 2017
Indicators value changes by year
Minimum:
331.96 mln
jan 1, 1999
Maximum:
1.154 bln
jan 1, 2015
At the date of observation
Value
Absolute change
Change from previous value
jan 1, 1991
345.49 mln
+345.49 mln
0.0%
jan 1, 1992
368.563 mln
+23.073 mln
6.68%
jan 1, 1993
371.279 mln
+2.716 mln
0.74%
jan 1, 1994
361.167 mln
-10.111 mln
-2.72%
jan 1, 1995
364.636 mln
+3.469 mln
0.96%
jan 1, 1996
387.884 mln
+23.248 mln
6.38%
jan 1, 1997
399.624 mln
+11.74 mln
3.03%
jan 1, 1998
391.254 mln
-8.37 mln
-2.09%
jan 1, 1999
331.96 mln
-59.294 mln
-15.15%
jan 1, 2000
359.803 mln
+27.842 mln
8.39%
jan 1, 2001
382.058 mln
+22.255 mln
6.19%
jan 1, 2002
379.007 mln
-3.051 mln
-0.8%
jan 1, 2003
397.273 mln
+18.265 mln
4.82%
jan 1, 2004
415.392 mln
+18.12 mln
4.56%
jan 1, 2005
462.878 mln
+47.486 mln
11.43%
jan 1, 2006
570.277 mln
+107.399 mln
23.2%
jan 1, 2007
626.393 mln
+56.116 mln
9.84%
jan 1, 2008
667.366 mln
+40.973 mln
6.54%
jan 1, 2009
799.435 mln
+132.069 mln
19.79%
jan 1, 2010
679.205 mln
-120.23 mln
-15.04%
jan 1, 2011
833.168 mln
+153.963 mln
22.67%
jan 1, 2012
1.017 bln
+184.284 mln
22.12%
jan 1, 2013
1.117 bln
+99.788 mln
9.81%
jan 1, 2014
1.142 bln
+24.577 mln
2.2%
jan 1, 2015
1.154 bln
+12.564 mln
1.1%
Ranking of countries by current statistics by years


Comments: