29
/
en
AIzaSyAYiBZKx7MnpbEhh9jyipgxe19OcubqV5w
April 1, 2024
204917
Namibia
NAM
true
2
1
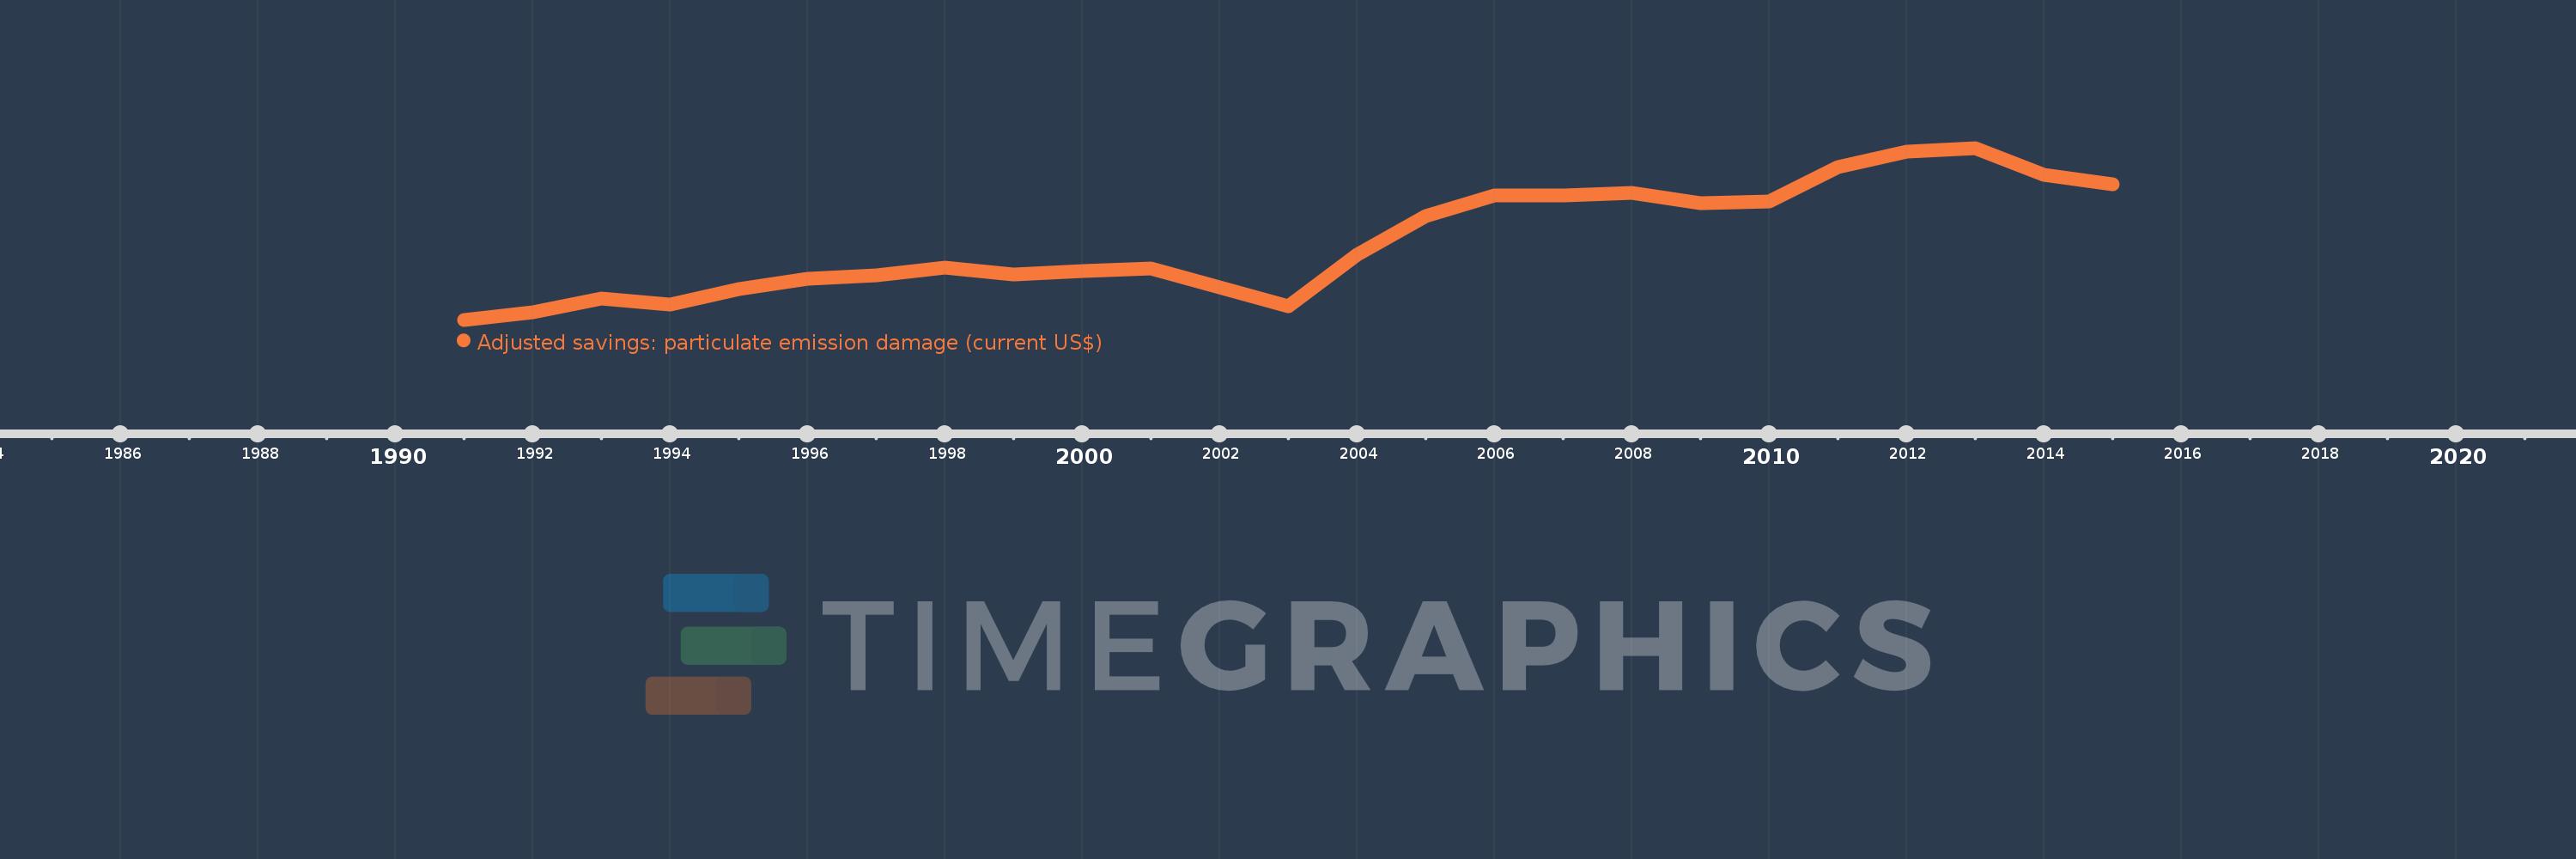
Adjusted savings: particulate emission damage (current US$)
2015,2014,2013,2012,2011,2010,2009,2008,2007,2006,2005,2004,2003,2002,2001,2000,1999,1998,1997,1996,1995,1994,1993,1992,1991
This statistics in other country:
AfghanistanAlbaniaAlgeriaAndorraAngolaAntigua and BarbudaArgentinaArmeniaAustraliaAustriaAzerbaijanBahamas, TheBahrainBangladeshBarbadosBelarusBelgiumBelizeBeninBhutanBoliviaBosnia and HerzegovinaBotswanaBrazilBrunei DarussalamBulgariaBurkina FasoBurundiCabo VerdeCambodiaCameroonCanadaCentral African RepublicChadChileChinaColombiaComorosCongo, Dem. Rep.Congo, Rep.Costa RicaCote d'IvoireCroatiaCubaCyprusCzech RepublicDenmarkDjiboutiDominicaDominican RepublicEcuadorEgypt, Arab Rep.El SalvadorEquatorial GuineaEritreaEstoniaEthiopiaFijiFinlandFranceGabonGambia, TheGeorgiaGermanyGhanaGreeceGrenadaGuatemalaGuineaGuinea-BissauGuyanaHaitiHondurasHong Kong SAR, ChinaHungaryIcelandIndiaIndonesiaIran, Islamic Rep.IraqIrelandIsraelItalyJamaicaJapanJordanKazakhstanKenyaKorea, Dem. People’s Rep.Korea, Rep.KuwaitKyrgyz RepublicLao PDRLatviaLebanonLesothoLiberiaLibyaLithuaniaLuxembourgMacao SAR, ChinaMacedonia, FYRMadagascarMalawiMalaysiaMaldivesMaliMaltaMauritaniaMauritiusMexicoMoldovaMonacoMongoliaMontenegroMoroccoMozambiqueMyanmarNamibiaNepalNetherlandsNew ZealandNicaraguaNigerNigeriaNorwayOmanPakistanPanamaPapua New GuineaParaguayPeruPhilippinesPolandPortugalPuerto RicoQatarRomaniaRussian FederationRwandaSan MarinoSao Tome and PrincipeSaudi ArabiaSenegalSerbiaSierra LeoneSingaporeSlovak RepublicSloveniaSolomon IslandsSomaliaSouth AfricaSpainSri LankaSt. Kitts and NevisSt. LuciaSt. Vincent and the GrenadinesSudanSurinameSwazilandSwedenSwitzerlandSyrian Arab RepublicTajikistanTanzaniaThailandTimor-LesteTogoTrinidad and TobagoTunisiaTurkeyTurkmenistanUgandaUkraineUnited Arab EmiratesUnited KingdomUnited StatesUruguayUzbekistanVanuatuVenezuela, RBVietnamWest Bank and GazaYemen, Rep.ZambiaZimbabwe Timeline:
This timeline shows a graph from 1991 to 2015 of Namibia. No data until 1990. Number of actual observations by date: 25.
Source name:
World Development Indicators
Source organization:
Data on health impacts from exposure to ambient PM2.5 pollution and household air pollution are from the Global Burden of Disease 2010 study. Data are provided by the Institute for Health Metrics and Evaluation at the University of Washington.
Categories, topics:
Economy & Growth, Environment
Last updated:
apr 23, 2017
Indicators value changes by year
Minimum:
43.49 mln
jan 1, 1991
Maximum:
104.554 mln
jan 1, 2013
At the date of observation
Value
Absolute change
Change from previous value
jan 1, 1991
43.49 mln
+43.49 mln
0.0%
jan 1, 1992
46.229 mln
+2.739 mln
6.3%
jan 1, 1993
51.028 mln
+4.8 mln
10.38%
jan 1, 1994
48.785 mln
-2.243 mln
-4.4%
jan 1, 1995
54.41 mln
+5.625 mln
11.53%
jan 1, 1996
57.96 mln
+3.55 mln
6.53%
jan 1, 1997
59.306 mln
+1.345 mln
2.32%
jan 1, 1998
62.122 mln
+2.817 mln
4.75%
jan 1, 1999
59.477 mln
-2.645 mln
-4.26%
jan 1, 2000
60.653 mln
+1.175 mln
1.98%
jan 1, 2001
61.763 mln
+1.111 mln
1.83%
jan 1, 2002
54.874 mln
-6.889 mln
-11.15%
jan 1, 2003
48.42 mln
-6.454 mln
-11.76%
jan 1, 2004
66.519 mln
+18.099 mln
37.38%
jan 1, 2005
80.481 mln
+13.963 mln
20.99%
jan 1, 2006
87.815 mln
+7.334 mln
9.11%
jan 1, 2007
87.699 mln
-116.54K
-0.13%
jan 1, 2008
88.573 mln
+874.062K
1.0%
jan 1, 2009
85.068 mln
-3.505 mln
-3.96%
jan 1, 2010
85.653 mln
+585.294K
0.69%
jan 1, 2011
97.801 mln
+12.147 mln
14.18%
jan 1, 2012
103.332 mln
+5.532 mln
5.66%
jan 1, 2013
104.554 mln
+1.221 mln
1.18%
jan 1, 2014
94.913 mln
-9.641 mln
-9.22%
jan 1, 2015
91.546 mln
-3.367 mln
-3.55%
Ranking of countries by current statistics by years


Comments: