29
/
en
AIzaSyAYiBZKx7MnpbEhh9jyipgxe19OcubqV5w
April 1, 2024
169608
Korea, Rep.
KOR
true
2
1
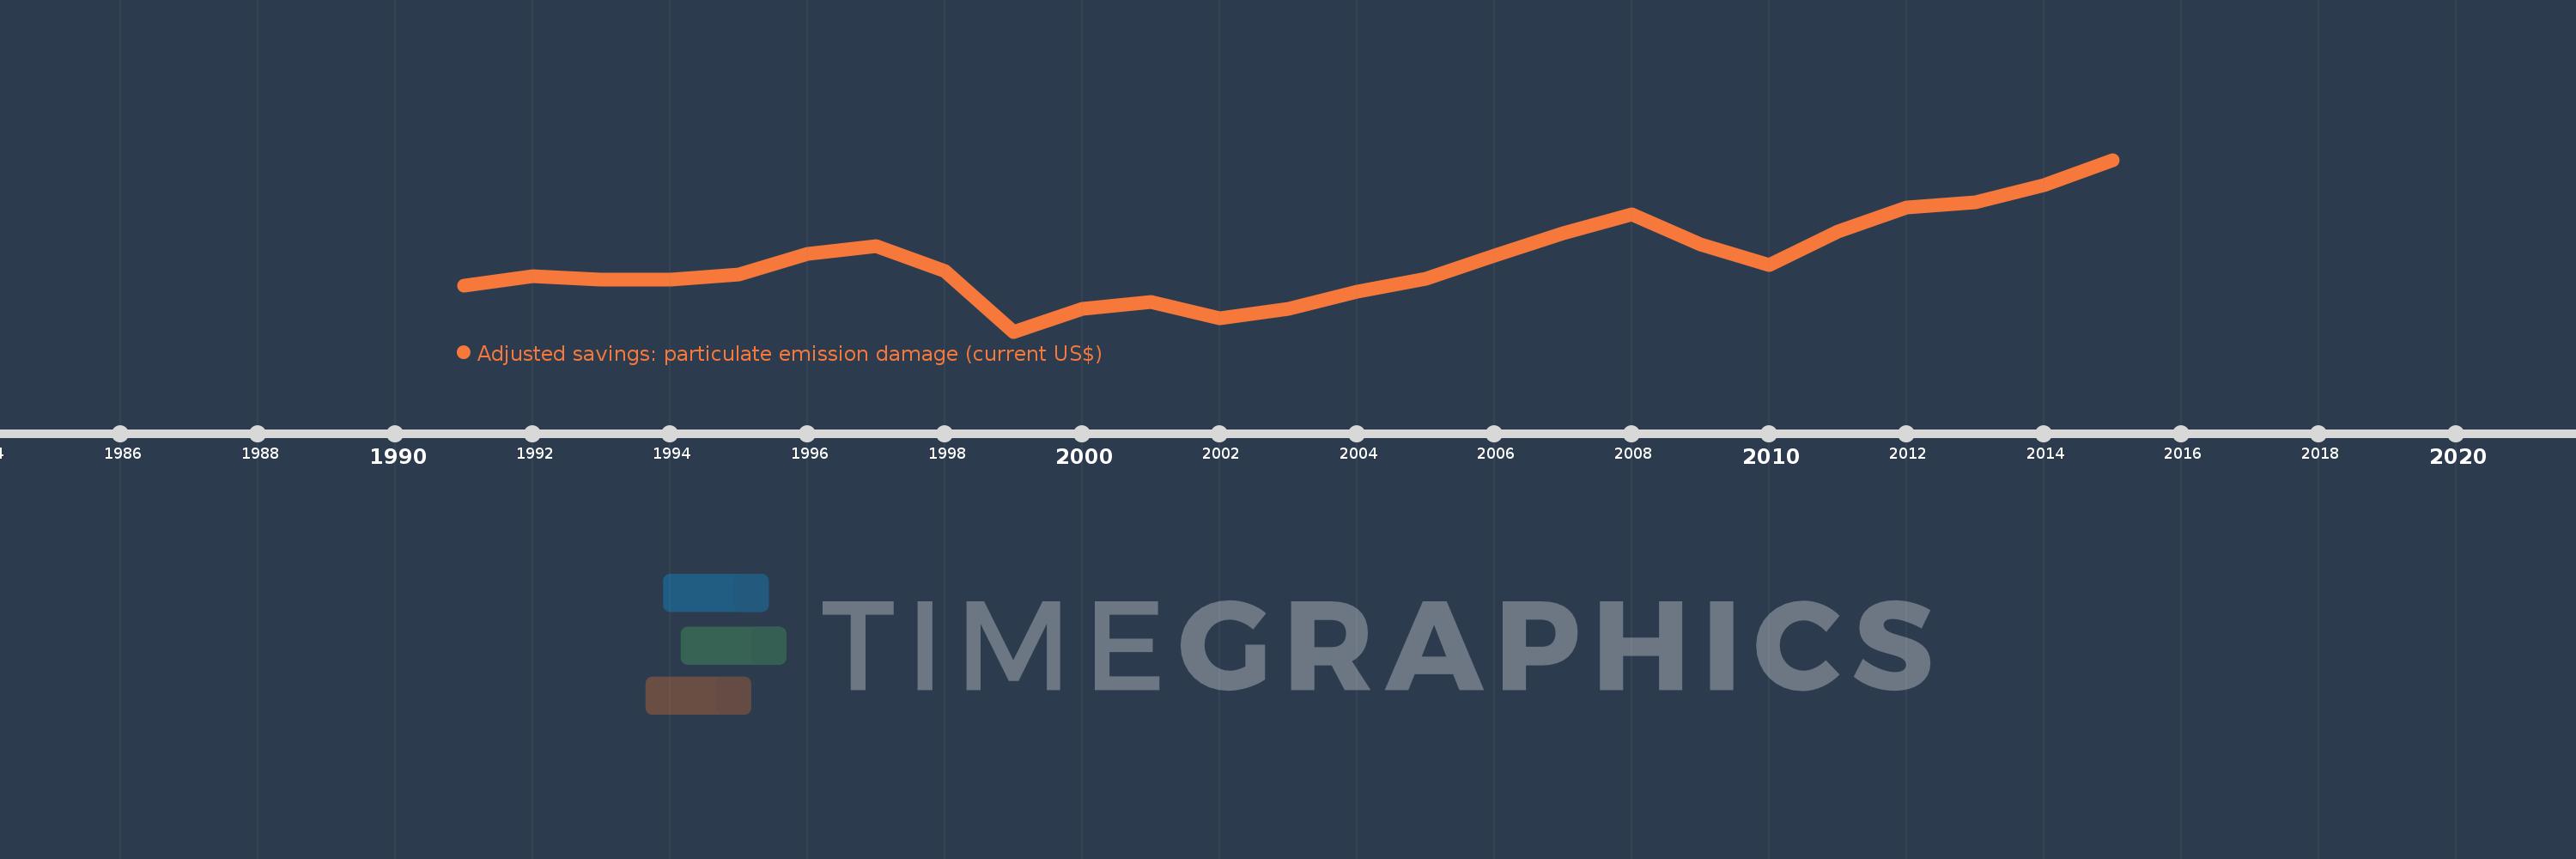
Adjusted savings: particulate emission damage (current US$)
2015,2014,2013,2012,2011,2010,2009,2008,2007,2006,2005,2004,2003,2002,2001,2000,1999,1998,1997,1996,1995,1994,1993,1992,1991
This statistics in other country:
AfghanistanAlbaniaAlgeriaAndorraAngolaAntigua and BarbudaArgentinaArmeniaAustraliaAustriaAzerbaijanBahamas, TheBahrainBangladeshBarbadosBelarusBelgiumBelizeBeninBhutanBoliviaBosnia and HerzegovinaBotswanaBrazilBrunei DarussalamBulgariaBurkina FasoBurundiCabo VerdeCambodiaCameroonCanadaCentral African RepublicChadChileChinaColombiaComorosCongo, Dem. Rep.Congo, Rep.Costa RicaCote d'IvoireCroatiaCubaCyprusCzech RepublicDenmarkDjiboutiDominicaDominican RepublicEcuadorEgypt, Arab Rep.El SalvadorEquatorial GuineaEritreaEstoniaEthiopiaFijiFinlandFranceGabonGambia, TheGeorgiaGermanyGhanaGreeceGrenadaGuatemalaGuineaGuinea-BissauGuyanaHaitiHondurasHong Kong SAR, ChinaHungaryIcelandIndiaIndonesiaIran, Islamic Rep.IraqIrelandIsraelItalyJamaicaJapanJordanKazakhstanKenyaKorea, Dem. People’s Rep.Korea, Rep.KuwaitKyrgyz RepublicLao PDRLatviaLebanonLesothoLiberiaLibyaLithuaniaLuxembourgMacao SAR, ChinaMacedonia, FYRMadagascarMalawiMalaysiaMaldivesMaliMaltaMauritaniaMauritiusMexicoMoldovaMonacoMongoliaMontenegroMoroccoMozambiqueMyanmarNamibiaNepalNetherlandsNew ZealandNicaraguaNigerNigeriaNorwayOmanPakistanPanamaPapua New GuineaParaguayPeruPhilippinesPolandPortugalPuerto RicoQatarRomaniaRussian FederationRwandaSan MarinoSao Tome and PrincipeSaudi ArabiaSenegalSerbiaSierra LeoneSingaporeSlovak RepublicSloveniaSolomon IslandsSomaliaSouth AfricaSpainSri LankaSt. Kitts and NevisSt. LuciaSt. Vincent and the GrenadinesSudanSurinameSwazilandSwedenSwitzerlandSyrian Arab RepublicTajikistanTanzaniaThailandTimor-LesteTogoTrinidad and TobagoTunisiaTurkeyTurkmenistanUgandaUkraineUnited Arab EmiratesUnited KingdomUnited StatesUruguayUzbekistanVanuatuVenezuela, RBVietnamWest Bank and GazaYemen, Rep.ZambiaZimbabwe Timeline:
This timeline shows a graph from 1991 to 2015 of Korea, Rep.. No data until 1990. Number of actual observations by date: 25.
Source name:
World Development Indicators
Source organization:
Data on health impacts from exposure to ambient PM2.5 pollution and household air pollution are from the Global Burden of Disease 2010 study. Data are provided by the Institute for Health Metrics and Evaluation at the University of Washington.
Categories, topics:
Economy & Growth, Environment
Last updated:
apr 23, 2017
Indicators value changes by year
Minimum:
905.665 mln
jan 1, 1999
Maximum:
1.976 bln
jan 1, 2015
At the date of observation
Value
Absolute change
Change from previous value
jan 1, 1991
1.19 bln
+1.19 bln
0.0%
jan 1, 1992
1.253 bln
+62.748 mln
5.27%
jan 1, 1993
1.232 bln
-21.523 mln
-1.72%
jan 1, 1994
1.227 bln
-4.577 mln
-0.37%
jan 1, 1995
1.261 bln
+34.448 mln
2.81%
jan 1, 1996
1.392 bln
+130.382 mln
10.34%
jan 1, 1997
1.439 bln
+47.255 mln
3.4%
jan 1, 1998
1.283 bln
-156.353 mln
-10.86%
jan 1, 1999
905.665 mln
-377.105 mln
-29.4%
jan 1, 2000
1.046 bln
+140.059 mln
15.46%
jan 1, 2001
1.091 bln
+45.706 mln
4.37%
jan 1, 2002
986.956 mln
-104.474 mln
-9.57%
jan 1, 2003
1.048 bln
+60.686 mln
6.15%
jan 1, 2004
1.156 bln
+108.226 mln
10.33%
jan 1, 2005
1.233 bln
+77.321 mln
6.69%
jan 1, 2006
1.381 bln
+147.953 mln
12.0%
jan 1, 2007
1.52 bln
+138.667 mln
10.04%
jan 1, 2008
1.637 bln
+117.672 mln
7.74%
jan 1, 2009
1.451 bln
-186.088 mln
-11.36%
jan 1, 2010
1.323 bln
-128.569 mln
-8.86%
jan 1, 2011
1.529 bln
+206.475 mln
15.61%
jan 1, 2012
1.678 bln
+149.064 mln
9.75%
jan 1, 2013
1.713 bln
+34.377 mln
2.05%
jan 1, 2014
1.818 bln
+105.021 mln
6.13%
jan 1, 2015
1.976 bln
+158.624 mln
8.73%
Ranking of countries by current statistics by years


Comments: