29
/
en
AIzaSyAYiBZKx7MnpbEhh9jyipgxe19OcubqV5w
April 1, 2024
280575
Venezuela, RB
VEN
true
2
1
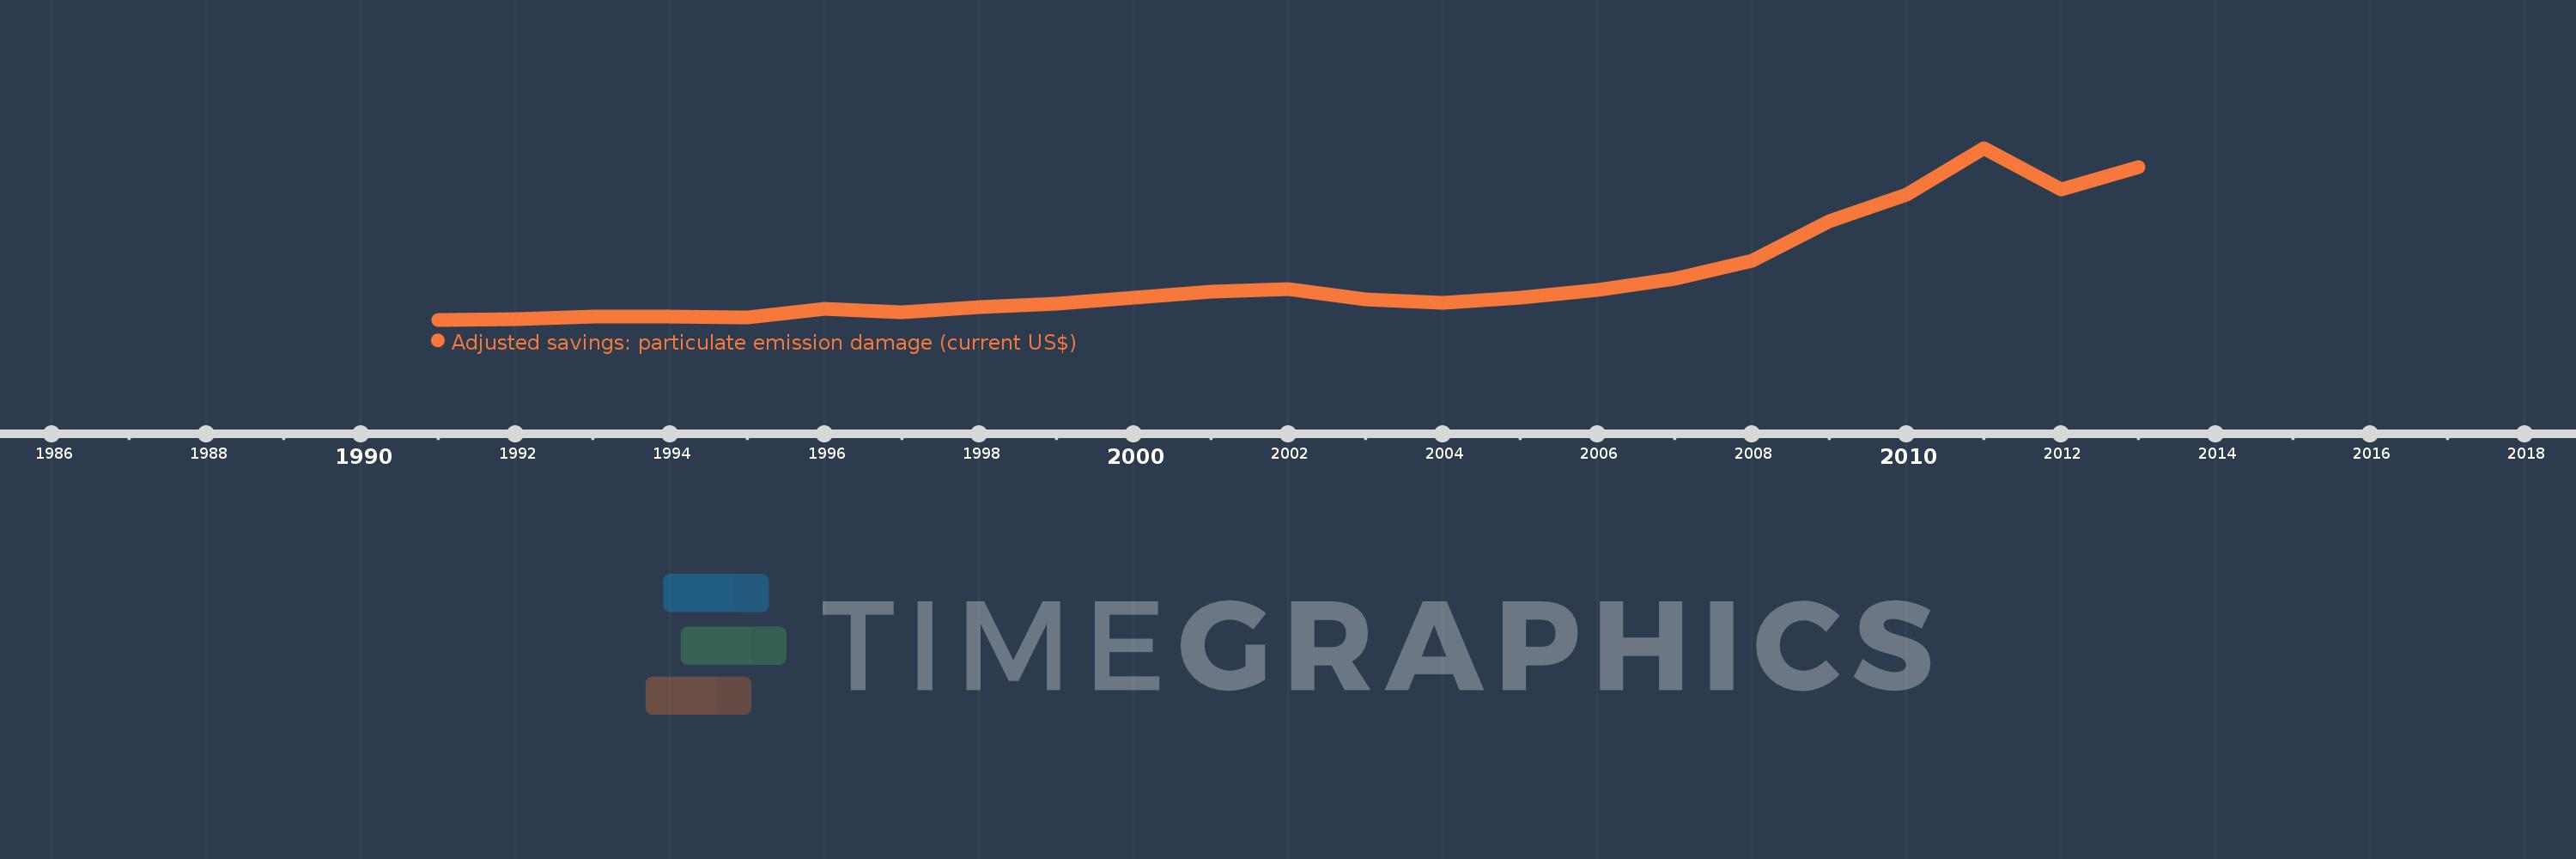
Adjusted savings: particulate emission damage (current US$)
2013,2012,2011,2010,2009,2008,2007,2006,2005,2004,2003,2002,2001,2000,1999,1998,1997,1996,1995,1994,1993,1992,1991
This statistics in other country:
AfghanistanAlbaniaAlgeriaAndorraAngolaAntigua and BarbudaArgentinaArmeniaAustraliaAustriaAzerbaijanBahamas, TheBahrainBangladeshBarbadosBelarusBelgiumBelizeBeninBhutanBoliviaBosnia and HerzegovinaBotswanaBrazilBrunei DarussalamBulgariaBurkina FasoBurundiCabo VerdeCambodiaCameroonCanadaCentral African RepublicChadChileChinaColombiaComorosCongo, Dem. Rep.Congo, Rep.Costa RicaCote d'IvoireCroatiaCubaCyprusCzech RepublicDenmarkDjiboutiDominicaDominican RepublicEcuadorEgypt, Arab Rep.El SalvadorEquatorial GuineaEritreaEstoniaEthiopiaFijiFinlandFranceGabonGambia, TheGeorgiaGermanyGhanaGreeceGrenadaGuatemalaGuineaGuinea-BissauGuyanaHaitiHondurasHong Kong SAR, ChinaHungaryIcelandIndiaIndonesiaIran, Islamic Rep.IraqIrelandIsraelItalyJamaicaJapanJordanKazakhstanKenyaKorea, Dem. People’s Rep.Korea, Rep.KuwaitKyrgyz RepublicLao PDRLatviaLebanonLesothoLiberiaLibyaLithuaniaLuxembourgMacao SAR, ChinaMacedonia, FYRMadagascarMalawiMalaysiaMaldivesMaliMaltaMauritaniaMauritiusMexicoMoldovaMonacoMongoliaMontenegroMoroccoMozambiqueMyanmarNamibiaNepalNetherlandsNew ZealandNicaraguaNigerNigeriaNorwayOmanPakistanPanamaPapua New GuineaParaguayPeruPhilippinesPolandPortugalPuerto RicoQatarRomaniaRussian FederationRwandaSan MarinoSao Tome and PrincipeSaudi ArabiaSenegalSerbiaSierra LeoneSingaporeSlovak RepublicSloveniaSolomon IslandsSomaliaSouth AfricaSpainSri LankaSt. Kitts and NevisSt. LuciaSt. Vincent and the GrenadinesSudanSurinameSwazilandSwedenSwitzerlandSyrian Arab RepublicTajikistanTanzaniaThailandTimor-LesteTogoTrinidad and TobagoTunisiaTurkeyTurkmenistanUgandaUkraineUnited Arab EmiratesUnited KingdomUnited StatesUruguayUzbekistanVanuatuVenezuela, RBVietnamWest Bank and GazaYemen, Rep.ZambiaZimbabwe Timeline:
This timeline shows a graph from 1991 to 2013 of Venezuela, RB. No data until 1990. Number of actual observations by date: 23.
Source name:
World Development Indicators
Source organization:
Data on health impacts from exposure to ambient PM2.5 pollution and household air pollution are from the Global Burden of Disease 2010 study. Data are provided by the Institute for Health Metrics and Evaluation at the University of Washington.
Categories, topics:
Economy & Growth, Environment
Last updated:
apr 23, 2017
Indicators value changes by year
Minimum:
67.548 mln
jan 1, 1991
Maximum:
494.321 mln
jan 1, 2011
At the date of observation
Value
Absolute change
Change from previous value
jan 1, 1991
67.548 mln
+67.548 mln
0.0%
jan 1, 1992
69.311 mln
+1.763 mln
2.61%
jan 1, 1993
74.963 mln
+5.652 mln
8.15%
jan 1, 1994
74.612 mln
-350.606K
-0.47%
jan 1, 1995
73.716 mln
-895.975K
-1.2%
jan 1, 1996
93.808 mln
+20.091 mln
27.26%
jan 1, 1997
85.326 mln
-8.481 mln
-9.04%
jan 1, 1998
99.944 mln
+14.618 mln
17.13%
jan 1, 1999
106.907 mln
+6.963 mln
6.97%
jan 1, 2000
122.027 mln
+15.12 mln
14.14%
jan 1, 2001
137.986 mln
+15.959 mln
13.08%
jan 1, 2002
143.134 mln
+5.148 mln
3.73%
jan 1, 2003
117.622 mln
-25.512 mln
-17.82%
jan 1, 2004
108.588 mln
-9.034 mln
-7.68%
jan 1, 2005
121.364 mln
+12.775 mln
11.76%
jan 1, 2006
142.605 mln
+21.241 mln
17.5%
jan 1, 2007
169.374 mln
+26.769 mln
18.77%
jan 1, 2008
214.811 mln
+45.437 mln
26.83%
jan 1, 2009
312.895 mln
+98.084 mln
45.66%
jan 1, 2010
378.651 mln
+65.755 mln
21.02%
jan 1, 2011
494.321 mln
+115.67 mln
30.55%
jan 1, 2012
390.287 mln
-104.034 mln
-21.05%
jan 1, 2013
447.304 mln
+57.017 mln
14.61%
Ranking of countries by current statistics by years


Comments: