30
/
AIzaSyAYiBZKx7MnpbEhh9jyipgxe19OcubqV5w
April 1, 2024
200066
Montenegro
MNE
true
2
1
Adjusted savings: particulate emission damage (current US$)
2015,2014,2013,2012,2011,2010,2009,2008,2007,2006,2005,2004,2003,2002,2001
Download
Global statistics library →Montenegro →

Adjusted savings: particulate emission damage (current US$)

This statistics in other country:

AfghanistanAlbaniaAlgeriaAndorraAngolaAntigua and BarbudaArgentinaArmeniaAustraliaAustriaAzerbaijanBahamas, TheBahrainBangladeshBarbadosBelarusBelgiumBelizeBeninBhutanBoliviaBosnia and HerzegovinaBotswanaBrazilBrunei DarussalamBulgariaBurkina FasoBurundiCabo VerdeCambodiaCameroonCanadaCentral African RepublicChadChileChinaColombiaComorosCongo, Dem. Rep.Congo, Rep.Costa RicaCote d'IvoireCroatiaCubaCyprusCzech RepublicDenmarkDjiboutiDominicaDominican RepublicEcuadorEgypt, Arab Rep.El SalvadorEquatorial GuineaEritreaEstoniaEthiopiaFijiFinlandFranceGabonGambia, TheGeorgiaGermanyGhanaGreeceGrenadaGuatemalaGuineaGuinea-BissauGuyanaHaitiHondurasHong Kong SAR, ChinaHungaryIcelandIndiaIndonesiaIran, Islamic Rep.IraqIrelandIsraelItalyJamaicaJapanJordanKazakhstanKenyaKorea, Dem. People’s Rep.Korea, Rep.KuwaitKyrgyz RepublicLao PDRLatviaLebanonLesothoLiberiaLibyaLithuaniaLuxembourgMacao SAR, ChinaMacedonia, FYRMadagascarMalawiMalaysiaMaldivesMaliMaltaMauritaniaMauritiusMexicoMoldovaMonacoMongoliaMontenegroMoroccoMozambiqueMyanmarNamibiaNepalNetherlandsNew ZealandNicaraguaNigerNigeriaNorwayOmanPakistanPanamaPapua New GuineaParaguayPeruPhilippinesPolandPortugalPuerto RicoQatarRomaniaRussian FederationRwandaSan MarinoSao Tome and PrincipeSaudi ArabiaSenegalSerbiaSierra LeoneSingaporeSlovak RepublicSloveniaSolomon IslandsSomaliaSouth AfricaSpainSri LankaSt. Kitts and NevisSt. LuciaSt. Vincent and the GrenadinesSudanSurinameSwazilandSwedenSwitzerlandSyrian Arab RepublicTajikistanTanzaniaThailandTimor-LesteTogoTrinidad and TobagoTunisiaTurkeyTurkmenistanUgandaUkraineUnited Arab EmiratesUnited KingdomUnited StatesUruguayUzbekistanVanuatuVenezuela, RBVietnamWest Bank and GazaYemen, Rep.ZambiaZimbabwe

Timeline:

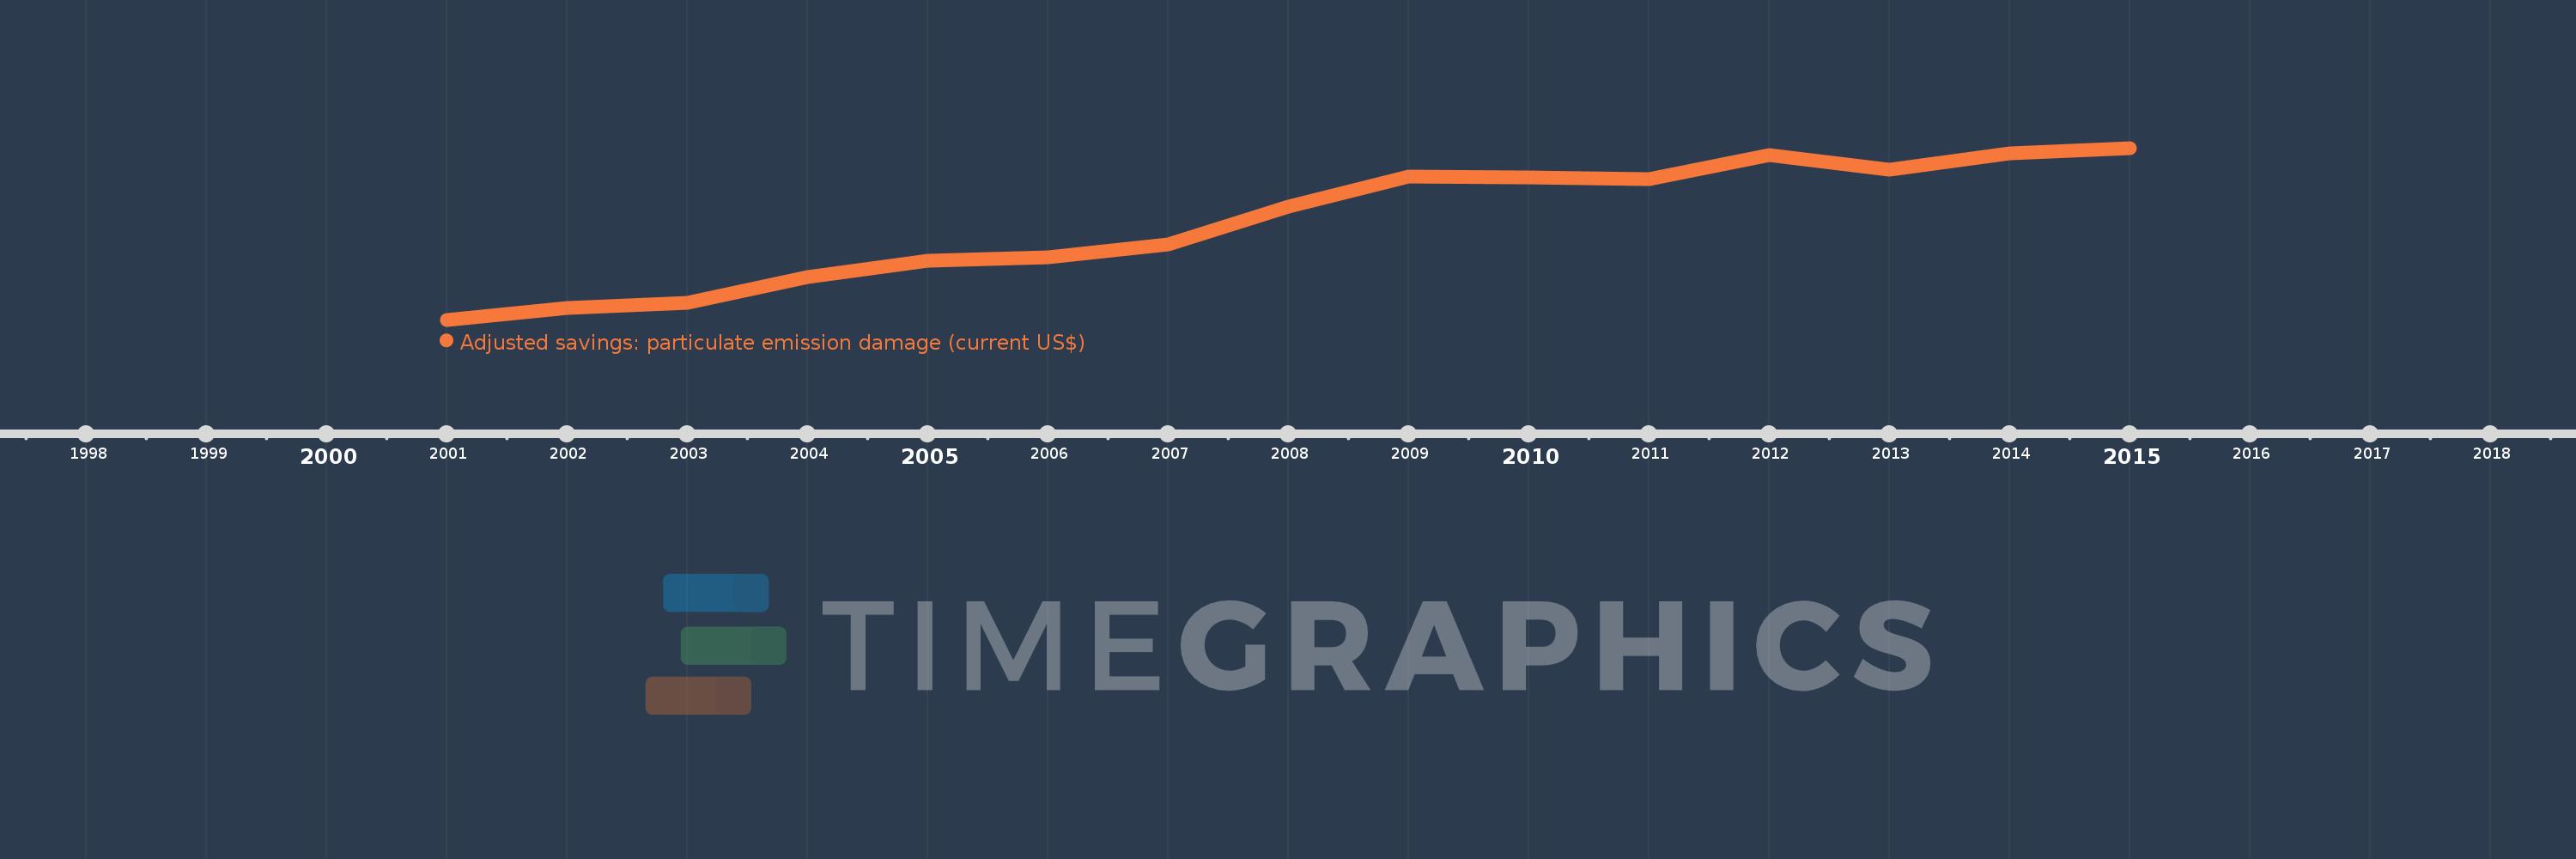
This timeline shows a graph from 2001 to 2015 of Montenegro. No data until 2000. Number of actual observations by date: 15.

Source name:

World Development Indicators

Source organization:

Data on health impacts from exposure to ambient PM2.5 pollution and household air pollution are from the Global Burden of Disease 2010 study. Data are provided by the Institute for Health Metrics and Evaluation at the University of Washington.

Categories, topics:

Economy & Growth, Environment

Last updated:

apr 23, 2017

Indicators value changes by year

Meaning:
15.922 mln
Minimum:
7.044 mln
jan 1, 2001
Maximum:
22.709 mln
jan 1, 2015
At the date of observation
Value
Absolute change
Change from the previous value
jan 1, 2001
7.044 mln
+7.044 mln
0.0%
jan 1, 2002
8.091 mln
+1.047 mln
14.86%
jan 1, 2003
8.614 mln
+522.511K
6.46%
jan 1, 2004
10.957 mln
+2.343 mln
27.2%
jan 1, 2005
12.402 mln
+1.446 mln
13.19%
jan 1, 2006
12.763 mln
+360.627K
2.91%
jan 1, 2007
13.927 mln
+1.164 mln
9.12%
jan 1, 2008
17.333 mln
+3.405 mln
24.45%
jan 1, 2009
20.135 mln
+2.802 mln
16.17%
jan 1, 2010
20.058 mln
-76.755K
-0.38%
jan 1, 2011
19.831 mln
-227.622K
-1.13%
jan 1, 2012
22.022 mln
+2.191 mln
11.05%
jan 1, 2013
20.736 mln
-1.286 mln
-5.84%
jan 1, 2014
22.215 mln
+1.479 mln
7.13%
jan 1, 2015
22.709 mln
+494.03K
2.22%

Ranking of countries by current statistics by years