29
/
en
AIzaSyAYiBZKx7MnpbEhh9jyipgxe19OcubqV5w
April 1, 2024
79171
Barbados
BRB
true
2
1
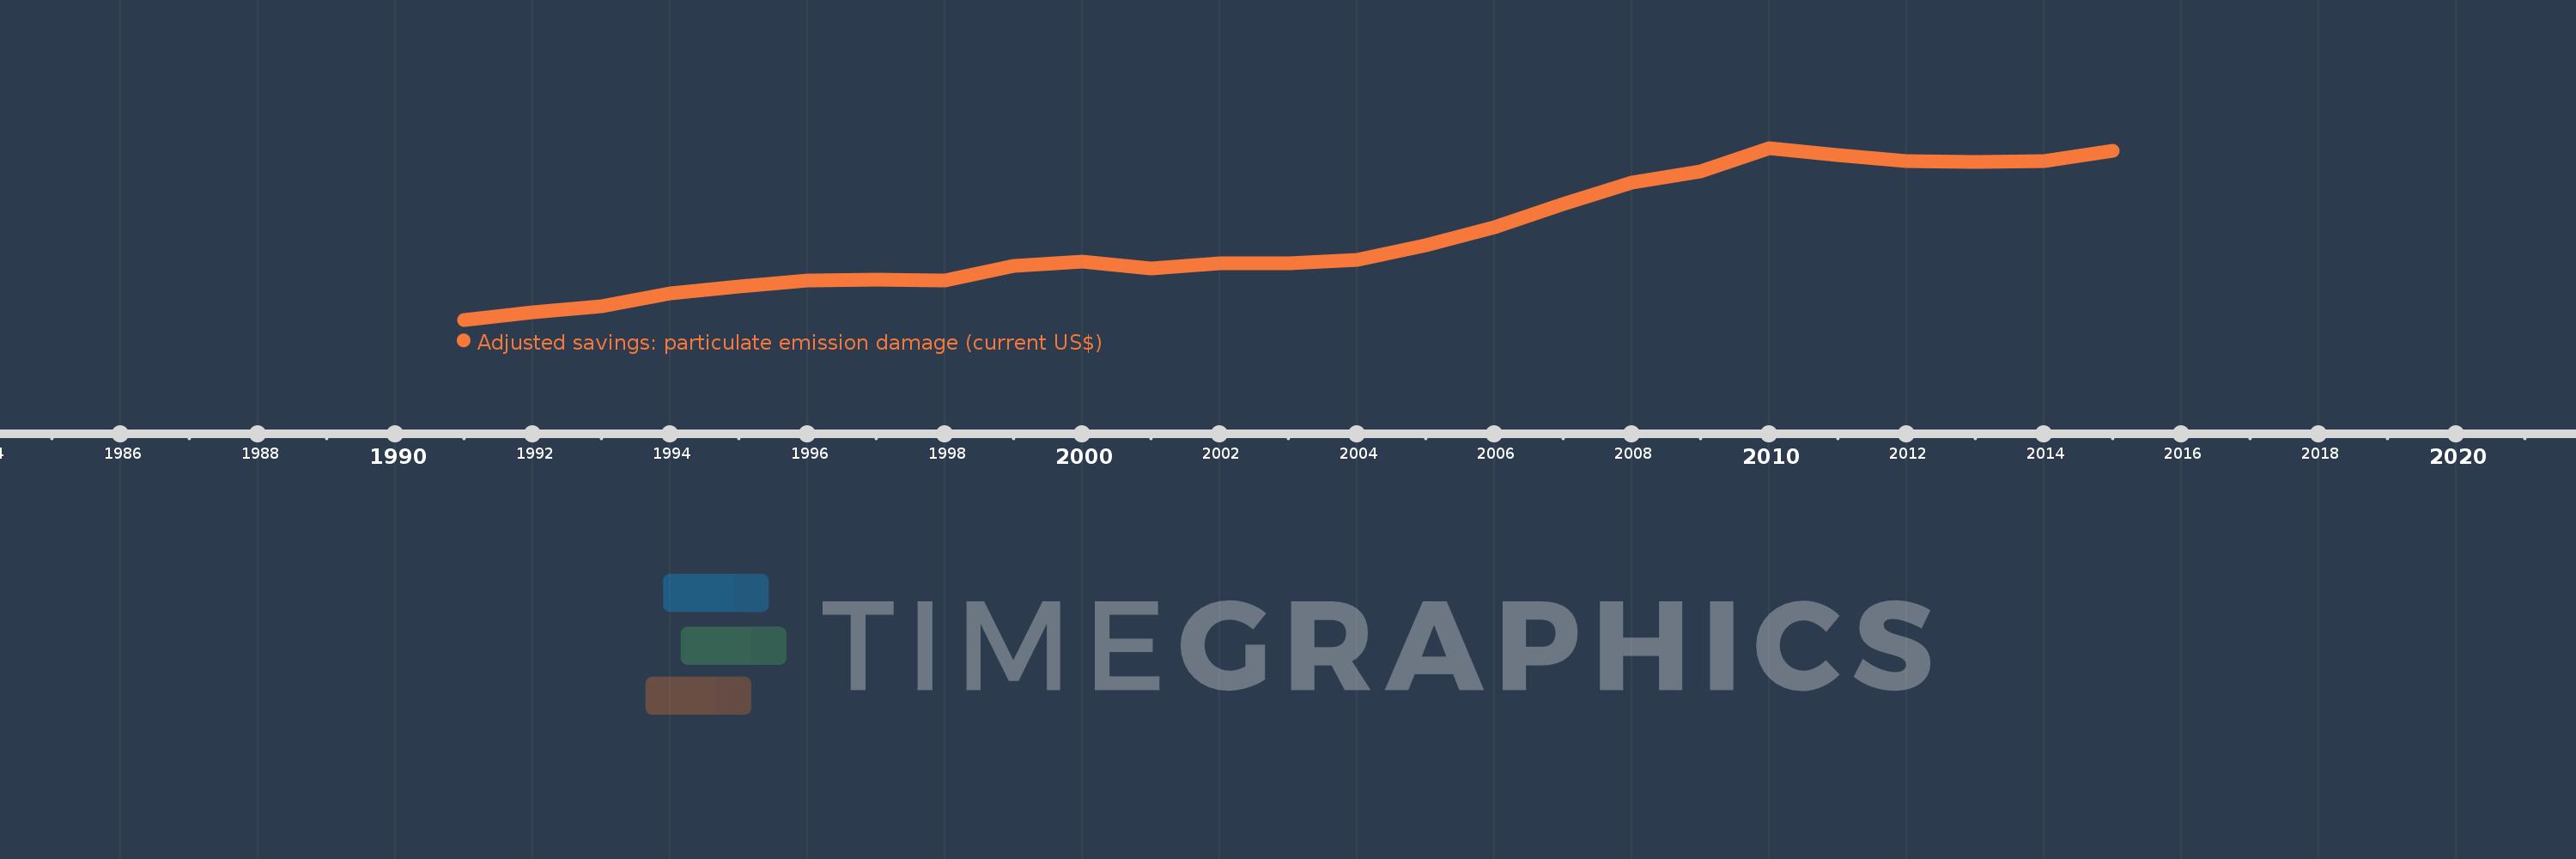
Adjusted savings: particulate emission damage (current US$)
2015,2014,2013,2012,2011,2010,2009,2008,2007,2006,2005,2004,2003,2002,2001,2000,1999,1998,1997,1996,1995,1994,1993,1992,1991
This statistics in other country:
AfghanistanAlbaniaAlgeriaAndorraAngolaAntigua and BarbudaArgentinaArmeniaAustraliaAustriaAzerbaijanBahamas, TheBahrainBangladeshBarbadosBelarusBelgiumBelizeBeninBhutanBoliviaBosnia and HerzegovinaBotswanaBrazilBrunei DarussalamBulgariaBurkina FasoBurundiCabo VerdeCambodiaCameroonCanadaCentral African RepublicChadChileChinaColombiaComorosCongo, Dem. Rep.Congo, Rep.Costa RicaCote d'IvoireCroatiaCubaCyprusCzech RepublicDenmarkDjiboutiDominicaDominican RepublicEcuadorEgypt, Arab Rep.El SalvadorEquatorial GuineaEritreaEstoniaEthiopiaFijiFinlandFranceGabonGambia, TheGeorgiaGermanyGhanaGreeceGrenadaGuatemalaGuineaGuinea-BissauGuyanaHaitiHondurasHong Kong SAR, ChinaHungaryIcelandIndiaIndonesiaIran, Islamic Rep.IraqIrelandIsraelItalyJamaicaJapanJordanKazakhstanKenyaKorea, Dem. People’s Rep.Korea, Rep.KuwaitKyrgyz RepublicLao PDRLatviaLebanonLesothoLiberiaLibyaLithuaniaLuxembourgMacao SAR, ChinaMacedonia, FYRMadagascarMalawiMalaysiaMaldivesMaliMaltaMauritaniaMauritiusMexicoMoldovaMonacoMongoliaMontenegroMoroccoMozambiqueMyanmarNamibiaNepalNetherlandsNew ZealandNicaraguaNigerNigeriaNorwayOmanPakistanPanamaPapua New GuineaParaguayPeruPhilippinesPolandPortugalPuerto RicoQatarRomaniaRussian FederationRwandaSan MarinoSao Tome and PrincipeSaudi ArabiaSenegalSerbiaSierra LeoneSingaporeSlovak RepublicSloveniaSolomon IslandsSomaliaSouth AfricaSpainSri LankaSt. Kitts and NevisSt. LuciaSt. Vincent and the GrenadinesSudanSurinameSwazilandSwedenSwitzerlandSyrian Arab RepublicTajikistanTanzaniaThailandTimor-LesteTogoTrinidad and TobagoTunisiaTurkeyTurkmenistanUgandaUkraineUnited Arab EmiratesUnited KingdomUnited StatesUruguayUzbekistanVanuatuVenezuela, RBVietnamWest Bank and GazaYemen, Rep.ZambiaZimbabwe Timeline:
This timeline shows a graph from 1991 to 2015 of Barbados. No data until 1990. Number of actual observations by date: 25.
Source name:
World Development Indicators
Source organization:
Data on health impacts from exposure to ambient PM2.5 pollution and household air pollution are from the Global Burden of Disease 2010 study. Data are provided by the Institute for Health Metrics and Evaluation at the University of Washington.
Categories, topics:
Economy & Growth, Environment
Last updated:
apr 23, 2017
Indicators value changes by year
Minimum:
6.322 mln
jan 1, 1991
Maximum:
11.812 mln
jan 1, 2010
At the date of observation
Value
Absolute change
Change from previous value
jan 1, 1991
6.322 mln
+6.322 mln
0.0%
jan 1, 1992
6.563 mln
+241.087K
3.81%
jan 1, 1993
6.754 mln
+191.531K
2.92%
jan 1, 1994
7.168 mln
+413.92K
6.13%
jan 1, 1995
7.376 mln
+207.407K
2.89%
jan 1, 1996
7.574 mln
+198.453K
2.69%
jan 1, 1997
7.605 mln
+30.603K
0.4%
jan 1, 1998
7.566 mln
-38.957K
-0.51%
jan 1, 1999
8.033 mln
+466.832K
6.17%
jan 1, 2000
8.168 mln
+135.646K
1.69%
jan 1, 2001
7.958 mln
-210.196K
-2.57%
jan 1, 2002
8.113 mln
+155.017K
1.95%
jan 1, 2003
8.126 mln
+12.458K
0.15%
jan 1, 2004
8.222 mln
+96.267K
1.18%
jan 1, 2005
8.696 mln
+473.727K
5.76%
jan 1, 2006
9.265 mln
+569.269K
6.55%
jan 1, 2007
10.015 mln
+749.698K
8.09%
jan 1, 2008
10.713 mln
+698.711K
6.98%
jan 1, 2009
11.065 mln
+351.67K
3.28%
jan 1, 2010
11.812 mln
+746.761K
6.75%
jan 1, 2011
11.595 mln
-216.743K
-1.83%
jan 1, 2012
11.403 mln
-192.254K
-1.66%
jan 1, 2013
11.376 mln
-26.773K
-0.23%
jan 1, 2014
11.384 mln
+8.3K
0.07%
jan 1, 2015
11.71 mln
+326.008K
2.86%
Ranking of countries by current statistics by years


Comments: