29
/
en
AIzaSyAYiBZKx7MnpbEhh9jyipgxe19OcubqV5w
April 1, 2024
191122
Malta
MLT
true
2
1
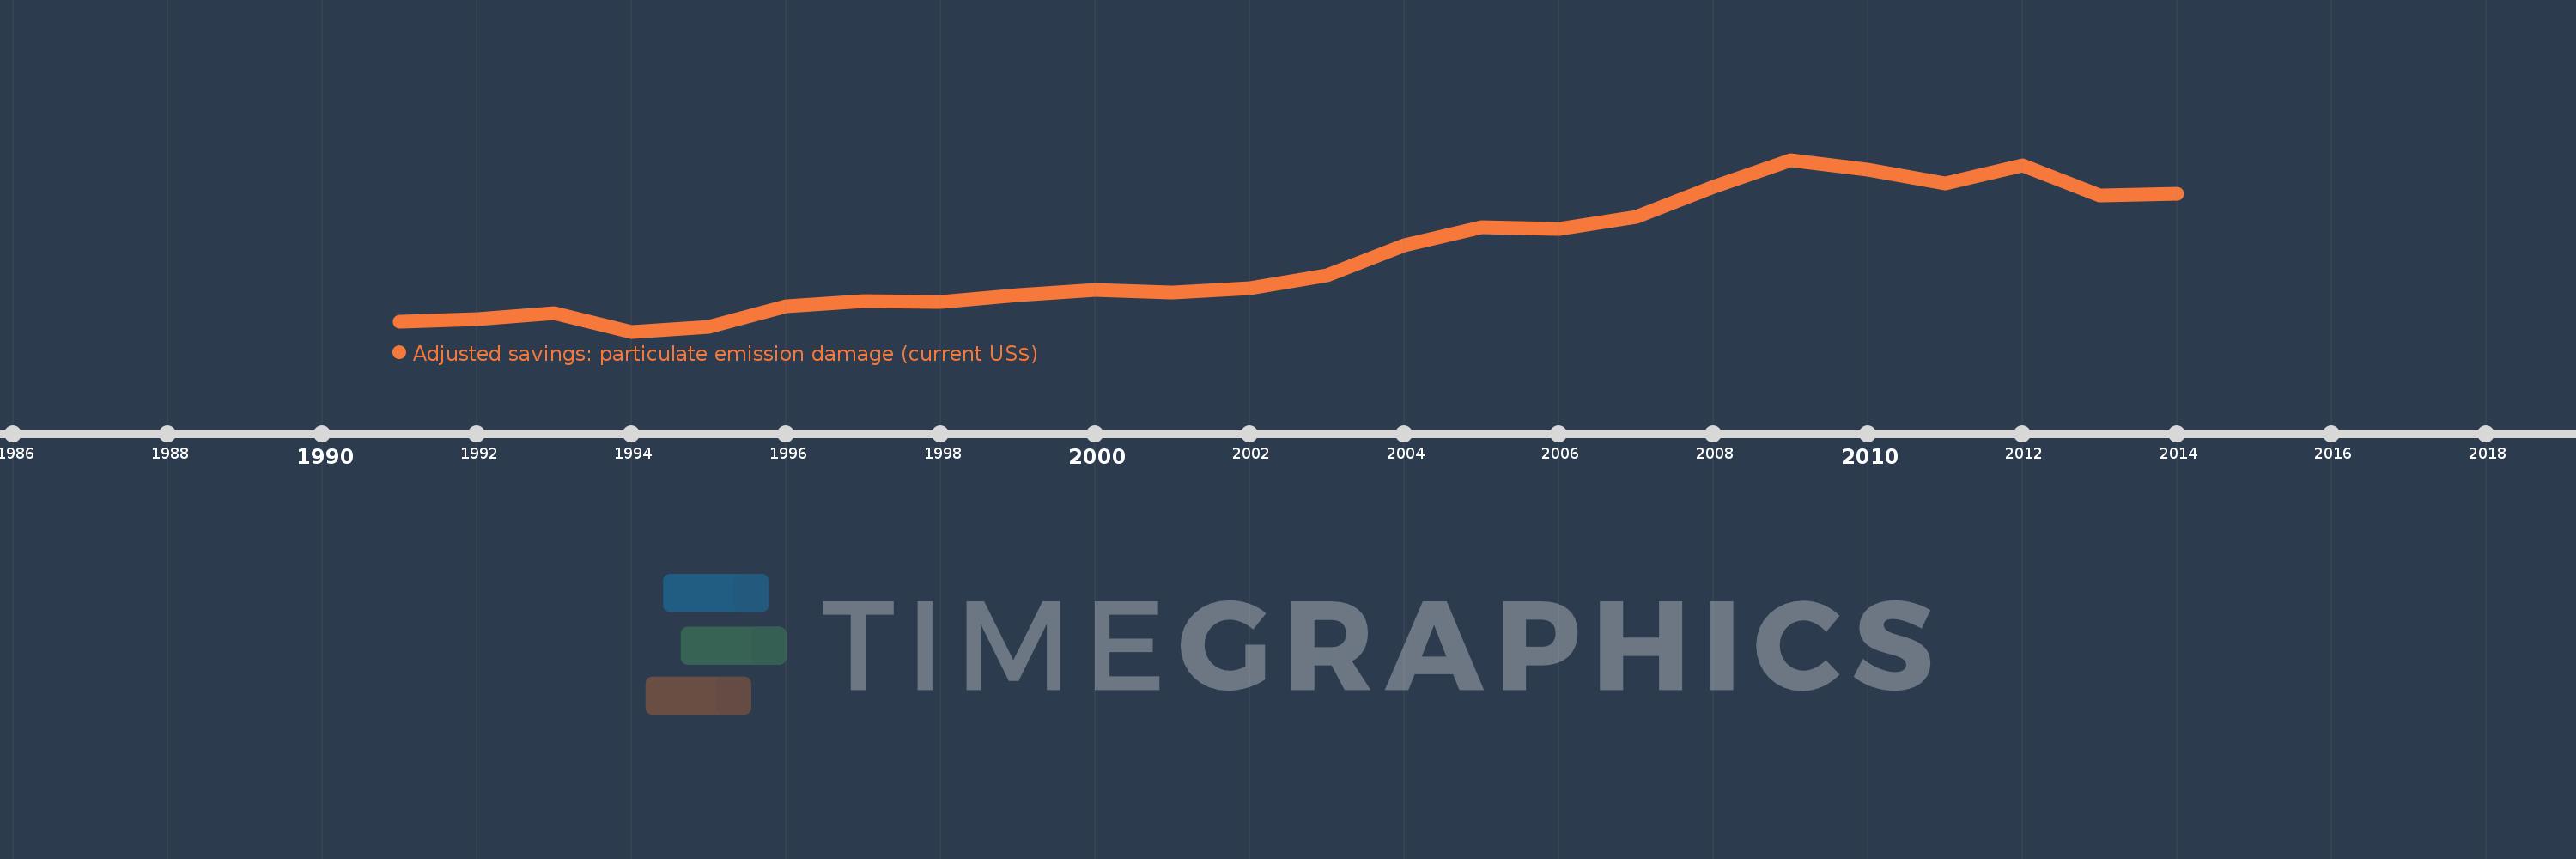
Adjusted savings: particulate emission damage (current US$)
2014,2013,2012,2011,2010,2009,2008,2007,2006,2005,2004,2003,2002,2001,2000,1999,1998,1997,1996,1995,1994,1993,1992,1991
This statistics in other country:
AfghanistanAlbaniaAlgeriaAndorraAngolaAntigua and BarbudaArgentinaArmeniaAustraliaAustriaAzerbaijanBahamas, TheBahrainBangladeshBarbadosBelarusBelgiumBelizeBeninBhutanBoliviaBosnia and HerzegovinaBotswanaBrazilBrunei DarussalamBulgariaBurkina FasoBurundiCabo VerdeCambodiaCameroonCanadaCentral African RepublicChadChileChinaColombiaComorosCongo, Dem. Rep.Congo, Rep.Costa RicaCote d'IvoireCroatiaCubaCyprusCzech RepublicDenmarkDjiboutiDominicaDominican RepublicEcuadorEgypt, Arab Rep.El SalvadorEquatorial GuineaEritreaEstoniaEthiopiaFijiFinlandFranceGabonGambia, TheGeorgiaGermanyGhanaGreeceGrenadaGuatemalaGuineaGuinea-BissauGuyanaHaitiHondurasHong Kong SAR, ChinaHungaryIcelandIndiaIndonesiaIran, Islamic Rep.IraqIrelandIsraelItalyJamaicaJapanJordanKazakhstanKenyaKorea, Dem. People’s Rep.Korea, Rep.KuwaitKyrgyz RepublicLao PDRLatviaLebanonLesothoLiberiaLibyaLithuaniaLuxembourgMacao SAR, ChinaMacedonia, FYRMadagascarMalawiMalaysiaMaldivesMaliMaltaMauritaniaMauritiusMexicoMoldovaMonacoMongoliaMontenegroMoroccoMozambiqueMyanmarNamibiaNepalNetherlandsNew ZealandNicaraguaNigerNigeriaNorwayOmanPakistanPanamaPapua New GuineaParaguayPeruPhilippinesPolandPortugalPuerto RicoQatarRomaniaRussian FederationRwandaSan MarinoSao Tome and PrincipeSaudi ArabiaSenegalSerbiaSierra LeoneSingaporeSlovak RepublicSloveniaSolomon IslandsSomaliaSouth AfricaSpainSri LankaSt. Kitts and NevisSt. LuciaSt. Vincent and the GrenadinesSudanSurinameSwazilandSwedenSwitzerlandSyrian Arab RepublicTajikistanTanzaniaThailandTimor-LesteTogoTrinidad and TobagoTunisiaTurkeyTurkmenistanUgandaUkraineUnited Arab EmiratesUnited KingdomUnited StatesUruguayUzbekistanVanuatuVenezuela, RBVietnamWest Bank and GazaYemen, Rep.ZambiaZimbabwe Timeline:
This timeline shows a graph from 1991 to 2014 of Malta. No data until 1990. Number of actual observations by date: 24.
Source name:
World Development Indicators
Source organization:
Data on health impacts from exposure to ambient PM2.5 pollution and household air pollution are from the Global Burden of Disease 2010 study. Data are provided by the Institute for Health Metrics and Evaluation at the University of Washington.
Categories, topics:
Economy & Growth, Environment
Last updated:
apr 23, 2017
Indicators value changes by year
Minimum:
7.295 mln
jan 1, 1994
Maximum:
17.807 mln
jan 1, 2009
At the date of observation
Value
Absolute change
Change from previous value
jan 1, 1991
7.883 mln
+7.883 mln
0.0%
jan 1, 1992
8.073 mln
+190.722K
2.42%
jan 1, 1993
8.437 mln
+363.794K
4.51%
jan 1, 1994
7.295 mln
-1.143 mln
-13.54%
jan 1, 1995
7.606 mln
+310.917K
4.26%
jan 1, 1996
8.824 mln
+1.219 mln
16.02%
jan 1, 1997
9.159 mln
+334.67K
3.79%
jan 1, 1998
9.115 mln
-44.005K
-0.48%
jan 1, 1999
9.531 mln
+416.613K
4.57%
jan 1, 2000
9.832 mln
+300.165K
3.15%
jan 1, 2001
9.666 mln
-165.628K
-1.68%
jan 1, 2002
9.944 mln
+277.685K
2.87%
jan 1, 2003
10.714 mln
+770.584K
7.75%
jan 1, 2004
12.602 mln
+1.887 mln
17.62%
jan 1, 2005
13.695 mln
+1.093 mln
8.68%
jan 1, 2006
13.597 mln
-98.454K
-0.72%
jan 1, 2007
14.311 mln
+713.98K
5.25%
jan 1, 2008
16.17 mln
+1.86 mln
13.0%
jan 1, 2009
17.807 mln
+1.636 mln
10.12%
jan 1, 2010
17.206 mln
-601.19K
-3.38%
jan 1, 2011
16.362 mln
-843.298K
-4.9%
jan 1, 2012
17.448 mln
+1.086 mln
6.64%
jan 1, 2013
15.647 mln
-1.801 mln
-10.32%
jan 1, 2014
15.705 mln
+57.674K
0.37%
Ranking of countries by current statistics by years


Comments: