29
/
en
AIzaSyAYiBZKx7MnpbEhh9jyipgxe19OcubqV5w
April 1, 2024
137601
Georgia
GEO
true
2
1
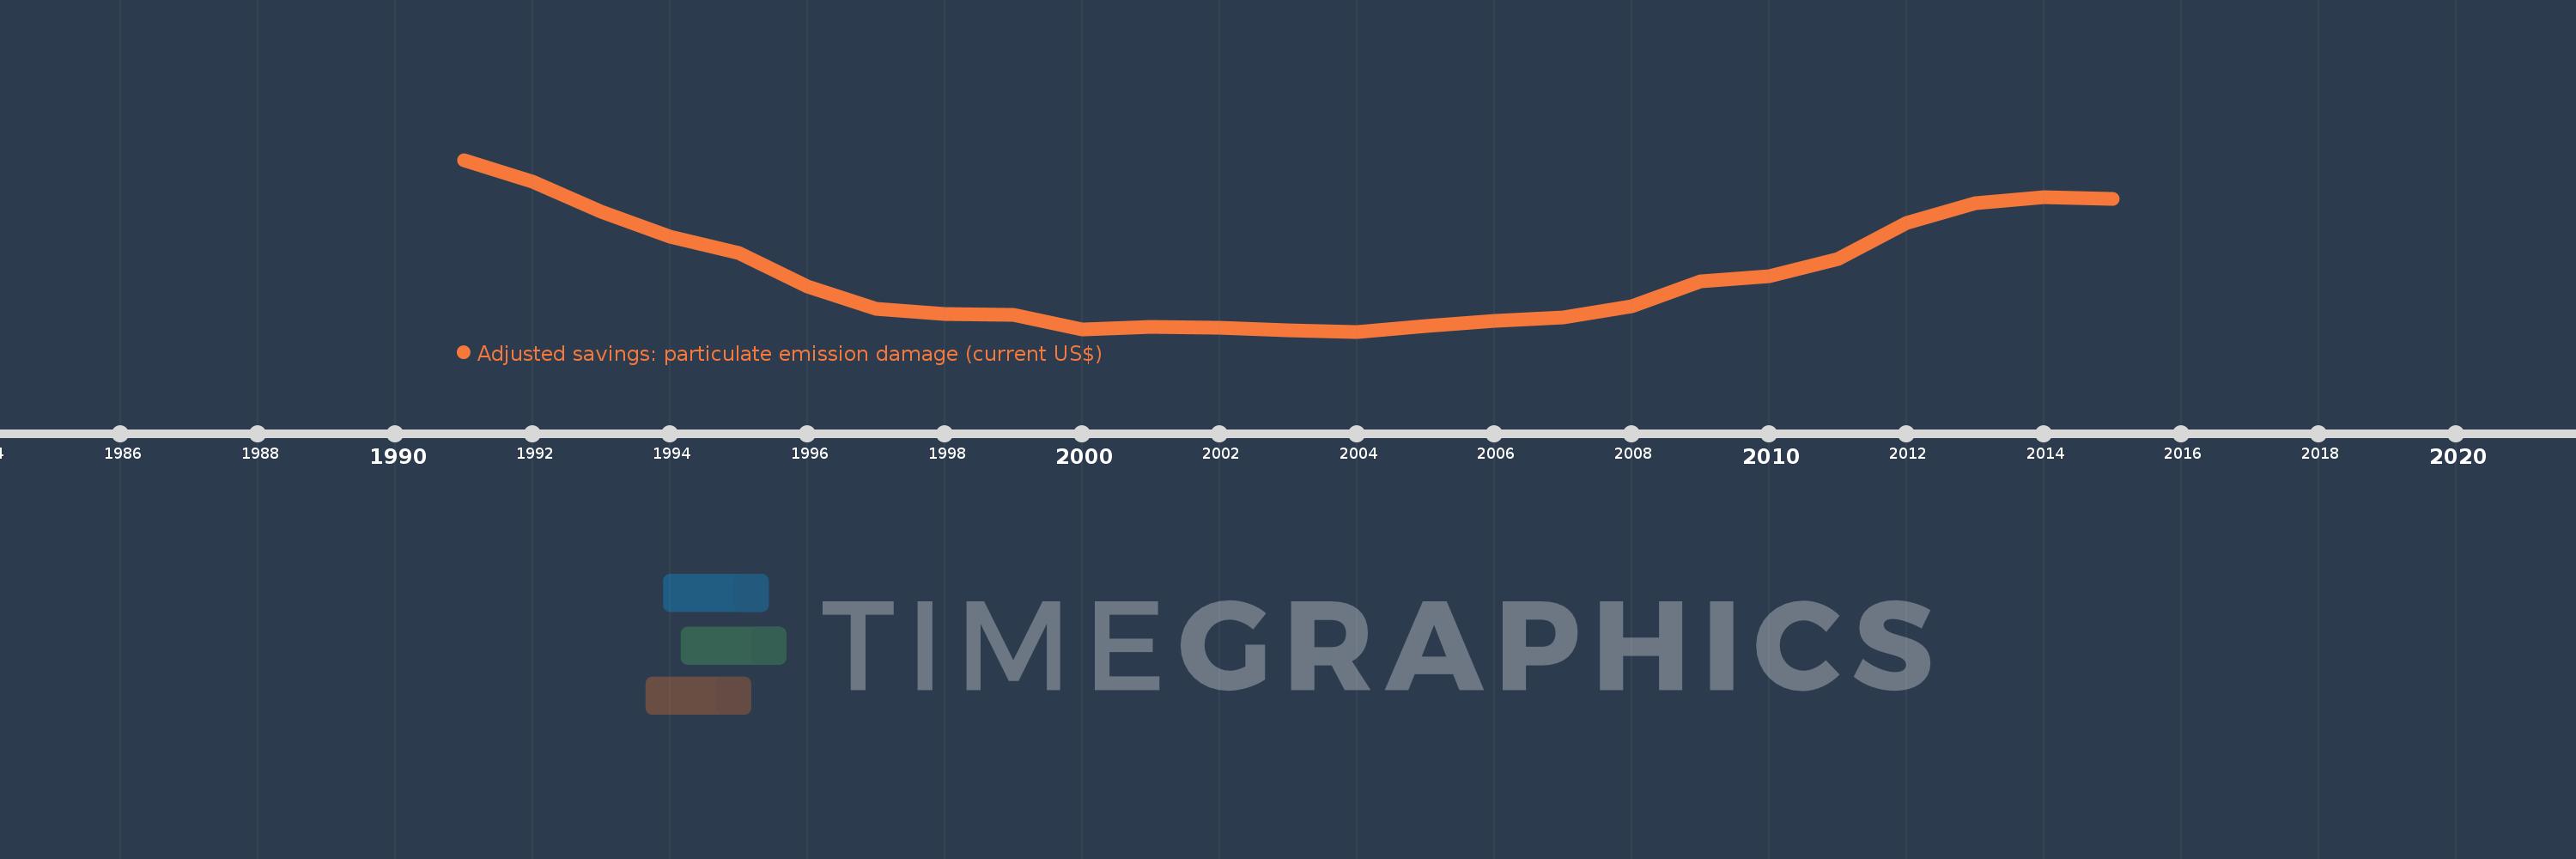
Adjusted savings: particulate emission damage (current US$)
2015,2014,2013,2012,2011,2010,2009,2008,2007,2006,2005,2004,2003,2002,2001,2000,1999,1998,1997,1996,1995,1994,1993,1992,1991
This statistics in other country:
AfghanistanAlbaniaAlgeriaAndorraAngolaAntigua and BarbudaArgentinaArmeniaAustraliaAustriaAzerbaijanBahamas, TheBahrainBangladeshBarbadosBelarusBelgiumBelizeBeninBhutanBoliviaBosnia and HerzegovinaBotswanaBrazilBrunei DarussalamBulgariaBurkina FasoBurundiCabo VerdeCambodiaCameroonCanadaCentral African RepublicChadChileChinaColombiaComorosCongo, Dem. Rep.Congo, Rep.Costa RicaCote d'IvoireCroatiaCubaCyprusCzech RepublicDenmarkDjiboutiDominicaDominican RepublicEcuadorEgypt, Arab Rep.El SalvadorEquatorial GuineaEritreaEstoniaEthiopiaFijiFinlandFranceGabonGambia, TheGeorgiaGermanyGhanaGreeceGrenadaGuatemalaGuineaGuinea-BissauGuyanaHaitiHondurasHong Kong SAR, ChinaHungaryIcelandIndiaIndonesiaIran, Islamic Rep.IraqIrelandIsraelItalyJamaicaJapanJordanKazakhstanKenyaKorea, Dem. People’s Rep.Korea, Rep.KuwaitKyrgyz RepublicLao PDRLatviaLebanonLesothoLiberiaLibyaLithuaniaLuxembourgMacao SAR, ChinaMacedonia, FYRMadagascarMalawiMalaysiaMaldivesMaliMaltaMauritaniaMauritiusMexicoMoldovaMonacoMongoliaMontenegroMoroccoMozambiqueMyanmarNamibiaNepalNetherlandsNew ZealandNicaraguaNigerNigeriaNorwayOmanPakistanPanamaPapua New GuineaParaguayPeruPhilippinesPolandPortugalPuerto RicoQatarRomaniaRussian FederationRwandaSan MarinoSao Tome and PrincipeSaudi ArabiaSenegalSerbiaSierra LeoneSingaporeSlovak RepublicSloveniaSolomon IslandsSomaliaSouth AfricaSpainSri LankaSt. Kitts and NevisSt. LuciaSt. Vincent and the GrenadinesSudanSurinameSwazilandSwedenSwitzerlandSyrian Arab RepublicTajikistanTanzaniaThailandTimor-LesteTogoTrinidad and TobagoTunisiaTurkeyTurkmenistanUgandaUkraineUnited Arab EmiratesUnited KingdomUnited StatesUruguayUzbekistanVanuatuVenezuela, RBVietnamWest Bank and GazaYemen, Rep.ZambiaZimbabwe Timeline:
This timeline shows a graph from 1991 to 2015 of Georgia. No data until 1990. Number of actual observations by date: 25.
Source name:
World Development Indicators
Source organization:
Data on health impacts from exposure to ambient PM2.5 pollution and household air pollution are from the Global Burden of Disease 2010 study. Data are provided by the Institute for Health Metrics and Evaluation at the University of Washington.
Categories, topics:
Economy & Growth, Environment
Last updated:
apr 23, 2017
Indicators value changes by year
Minimum:
30.433 mln
jan 1, 2004
Maximum:
155.611 mln
jan 1, 1991
At the date of observation
Value
Absolute change
Change from previous value
jan 1, 1991
155.611 mln
+155.611 mln
0.0%
jan 1, 1992
139.728 mln
-15.883 mln
-10.21%
jan 1, 1993
117.513 mln
-22.214 mln
-15.9%
jan 1, 1994
99.664 mln
-17.849 mln
-15.19%
jan 1, 1995
87.471 mln
-12.193 mln
-12.23%
jan 1, 1996
63.045 mln
-24.426 mln
-27.92%
jan 1, 1997
46.811 mln
-16.234 mln
-25.75%
jan 1, 1998
43.151 mln
-3.66 mln
-7.82%
jan 1, 1999
42.854 mln
-297.477K
-0.69%
jan 1, 2000
31.946 mln
-10.908 mln
-25.45%
jan 1, 2001
33.812 mln
+1.866 mln
5.84%
jan 1, 2002
33.428 mln
-384.196K
-1.14%
jan 1, 2003
31.443 mln
-1.985 mln
-5.94%
jan 1, 2004
30.433 mln
-1.009 mln
-3.21%
jan 1, 2005
34.798 mln
+4.365 mln
14.34%
jan 1, 2006
38.013 mln
+3.214 mln
9.24%
jan 1, 2007
40.556 mln
+2.543 mln
6.69%
jan 1, 2008
48.75 mln
+8.195 mln
20.21%
jan 1, 2009
67.319 mln
+18.568 mln
38.09%
jan 1, 2010
70.669 mln
+3.35 mln
4.98%
jan 1, 2011
83.548 mln
+12.878 mln
18.22%
jan 1, 2012
109.833 mln
+26.285 mln
31.46%
jan 1, 2013
124.236 mln
+14.403 mln
13.11%
jan 1, 2014
128.681 mln
+4.445 mln
3.58%
jan 1, 2015
126.978 mln
-1.703 mln
-1.32%
Ranking of countries by current statistics by years


Comments: