29
/
en
AIzaSyAYiBZKx7MnpbEhh9jyipgxe19OcubqV5w
April 1, 2024
69430
Argentina
ARG
true
2
1
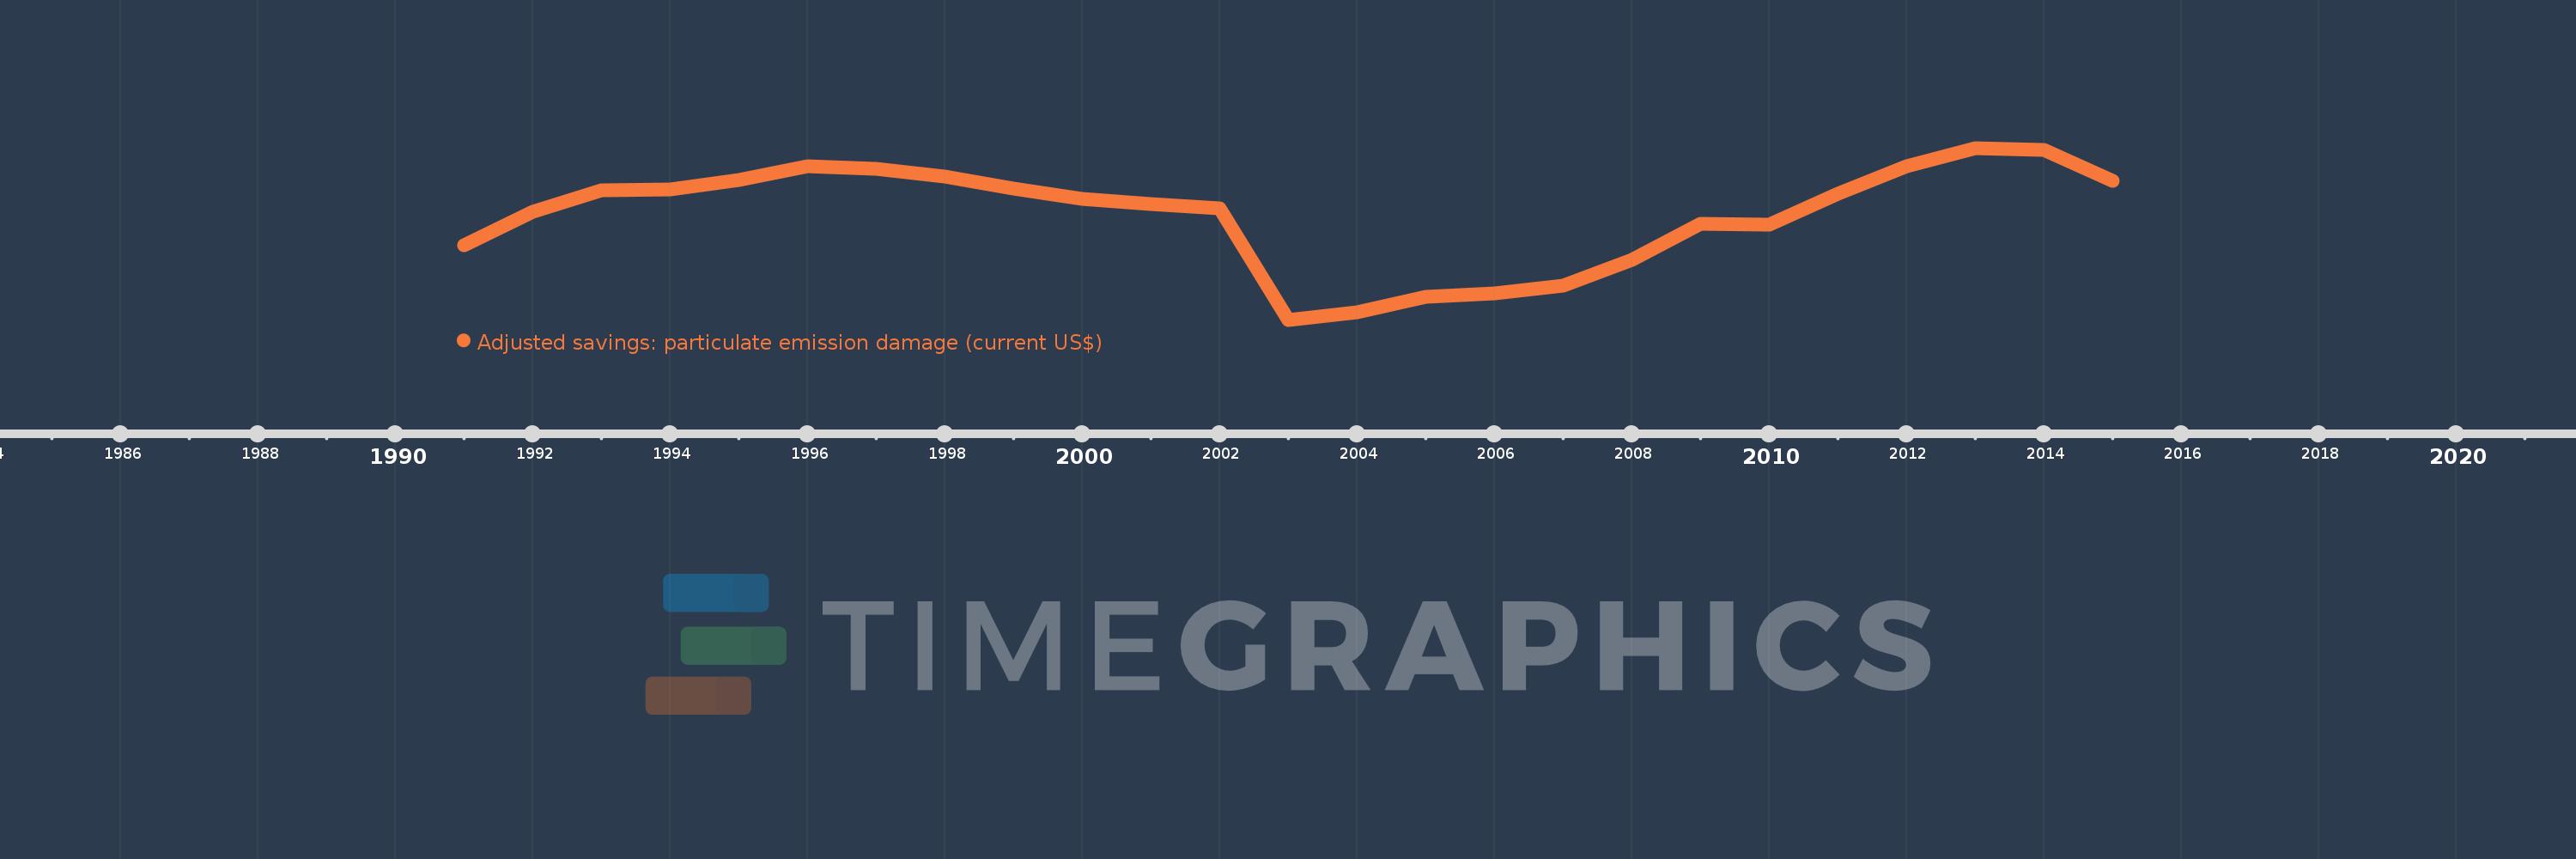
Adjusted savings: particulate emission damage (current US$)
2015,2014,2013,2012,2011,2010,2009,2008,2007,2006,2005,2004,2003,2002,2001,2000,1999,1998,1997,1996,1995,1994,1993,1992,1991
This statistics in other country:
AfghanistanAlbaniaAlgeriaAndorraAngolaAntigua and BarbudaArgentinaArmeniaAustraliaAustriaAzerbaijanBahamas, TheBahrainBangladeshBarbadosBelarusBelgiumBelizeBeninBhutanBoliviaBosnia and HerzegovinaBotswanaBrazilBrunei DarussalamBulgariaBurkina FasoBurundiCabo VerdeCambodiaCameroonCanadaCentral African RepublicChadChileChinaColombiaComorosCongo, Dem. Rep.Congo, Rep.Costa RicaCote d'IvoireCroatiaCubaCyprusCzech RepublicDenmarkDjiboutiDominicaDominican RepublicEcuadorEgypt, Arab Rep.El SalvadorEquatorial GuineaEritreaEstoniaEthiopiaFijiFinlandFranceGabonGambia, TheGeorgiaGermanyGhanaGreeceGrenadaGuatemalaGuineaGuinea-BissauGuyanaHaitiHondurasHong Kong SAR, ChinaHungaryIcelandIndiaIndonesiaIran, Islamic Rep.IraqIrelandIsraelItalyJamaicaJapanJordanKazakhstanKenyaKorea, Dem. People’s Rep.Korea, Rep.KuwaitKyrgyz RepublicLao PDRLatviaLebanonLesothoLiberiaLibyaLithuaniaLuxembourgMacao SAR, ChinaMacedonia, FYRMadagascarMalawiMalaysiaMaldivesMaliMaltaMauritaniaMauritiusMexicoMoldovaMonacoMongoliaMontenegroMoroccoMozambiqueMyanmarNamibiaNepalNetherlandsNew ZealandNicaraguaNigerNigeriaNorwayOmanPakistanPanamaPapua New GuineaParaguayPeruPhilippinesPolandPortugalPuerto RicoQatarRomaniaRussian FederationRwandaSan MarinoSao Tome and PrincipeSaudi ArabiaSenegalSerbiaSierra LeoneSingaporeSlovak RepublicSloveniaSolomon IslandsSomaliaSouth AfricaSpainSri LankaSt. Kitts and NevisSt. LuciaSt. Vincent and the GrenadinesSudanSurinameSwazilandSwedenSwitzerlandSyrian Arab RepublicTajikistanTanzaniaThailandTimor-LesteTogoTrinidad and TobagoTunisiaTurkeyTurkmenistanUgandaUkraineUnited Arab EmiratesUnited KingdomUnited StatesUruguayUzbekistanVanuatuVenezuela, RBVietnamWest Bank and GazaYemen, Rep.ZambiaZimbabwe Timeline:
This timeline shows a graph from 1991 to 2015 of Argentina. No data until 1990. Number of actual observations by date: 25.
Source name:
World Development Indicators
Source organization:
Data on health impacts from exposure to ambient PM2.5 pollution and household air pollution are from the Global Burden of Disease 2010 study. Data are provided by the Institute for Health Metrics and Evaluation at the University of Washington.
Categories, topics:
Economy & Growth, Environment
Last updated:
apr 23, 2017
Indicators value changes by year
Minimum:
168.172 mln
jan 1, 2003
Maximum:
590.684 mln
jan 1, 2013
At the date of observation
Value
Absolute change
Change from previous value
jan 1, 1991
351.308 mln
+351.308 mln
0.0%
jan 1, 1992
434.053 mln
+82.745 mln
23.55%
jan 1, 1993
485.574 mln
+51.521 mln
11.87%
jan 1, 1994
488.399 mln
+2.825 mln
0.58%
jan 1, 1995
511.37 mln
+22.971 mln
4.7%
jan 1, 1996
544.669 mln
+33.299 mln
6.51%
jan 1, 1997
539.871 mln
-4.798 mln
-0.88%
jan 1, 1998
520.783 mln
-19.089 mln
-3.54%
jan 1, 1999
490.642 mln
-30.141 mln
-5.79%
jan 1, 2000
466.168 mln
-24.474 mln
-4.99%
jan 1, 2001
451.872 mln
-14.295 mln
-3.07%
jan 1, 2002
443.108 mln
-8.764 mln
-1.94%
jan 1, 2003
168.172 mln
-274.937 mln
-62.05%
jan 1, 2004
186.456 mln
+18.285 mln
10.87%
jan 1, 2005
223.617 mln
+37.16 mln
19.93%
jan 1, 2006
233.028 mln
+9.411 mln
4.21%
jan 1, 2007
251.288 mln
+18.26 mln
7.84%
jan 1, 2008
315.468 mln
+64.18 mln
25.54%
jan 1, 2009
403.372 mln
+87.903 mln
27.86%
jan 1, 2010
402.311 mln
-1.061 mln
-0.26%
jan 1, 2011
478.657 mln
+76.346 mln
18.98%
jan 1, 2012
545.967 mln
+67.31 mln
14.06%
jan 1, 2013
590.684 mln
+44.717 mln
8.19%
jan 1, 2014
585.683 mln
-5.001 mln
-0.85%
jan 1, 2015
510.451 mln
-75.232 mln
-12.85%
Ranking of countries by current statistics by years


Comments: