29
/
en
AIzaSyAYiBZKx7MnpbEhh9jyipgxe19OcubqV5w
April 1, 2024
86791
Bolivia
BOL
true
2
1
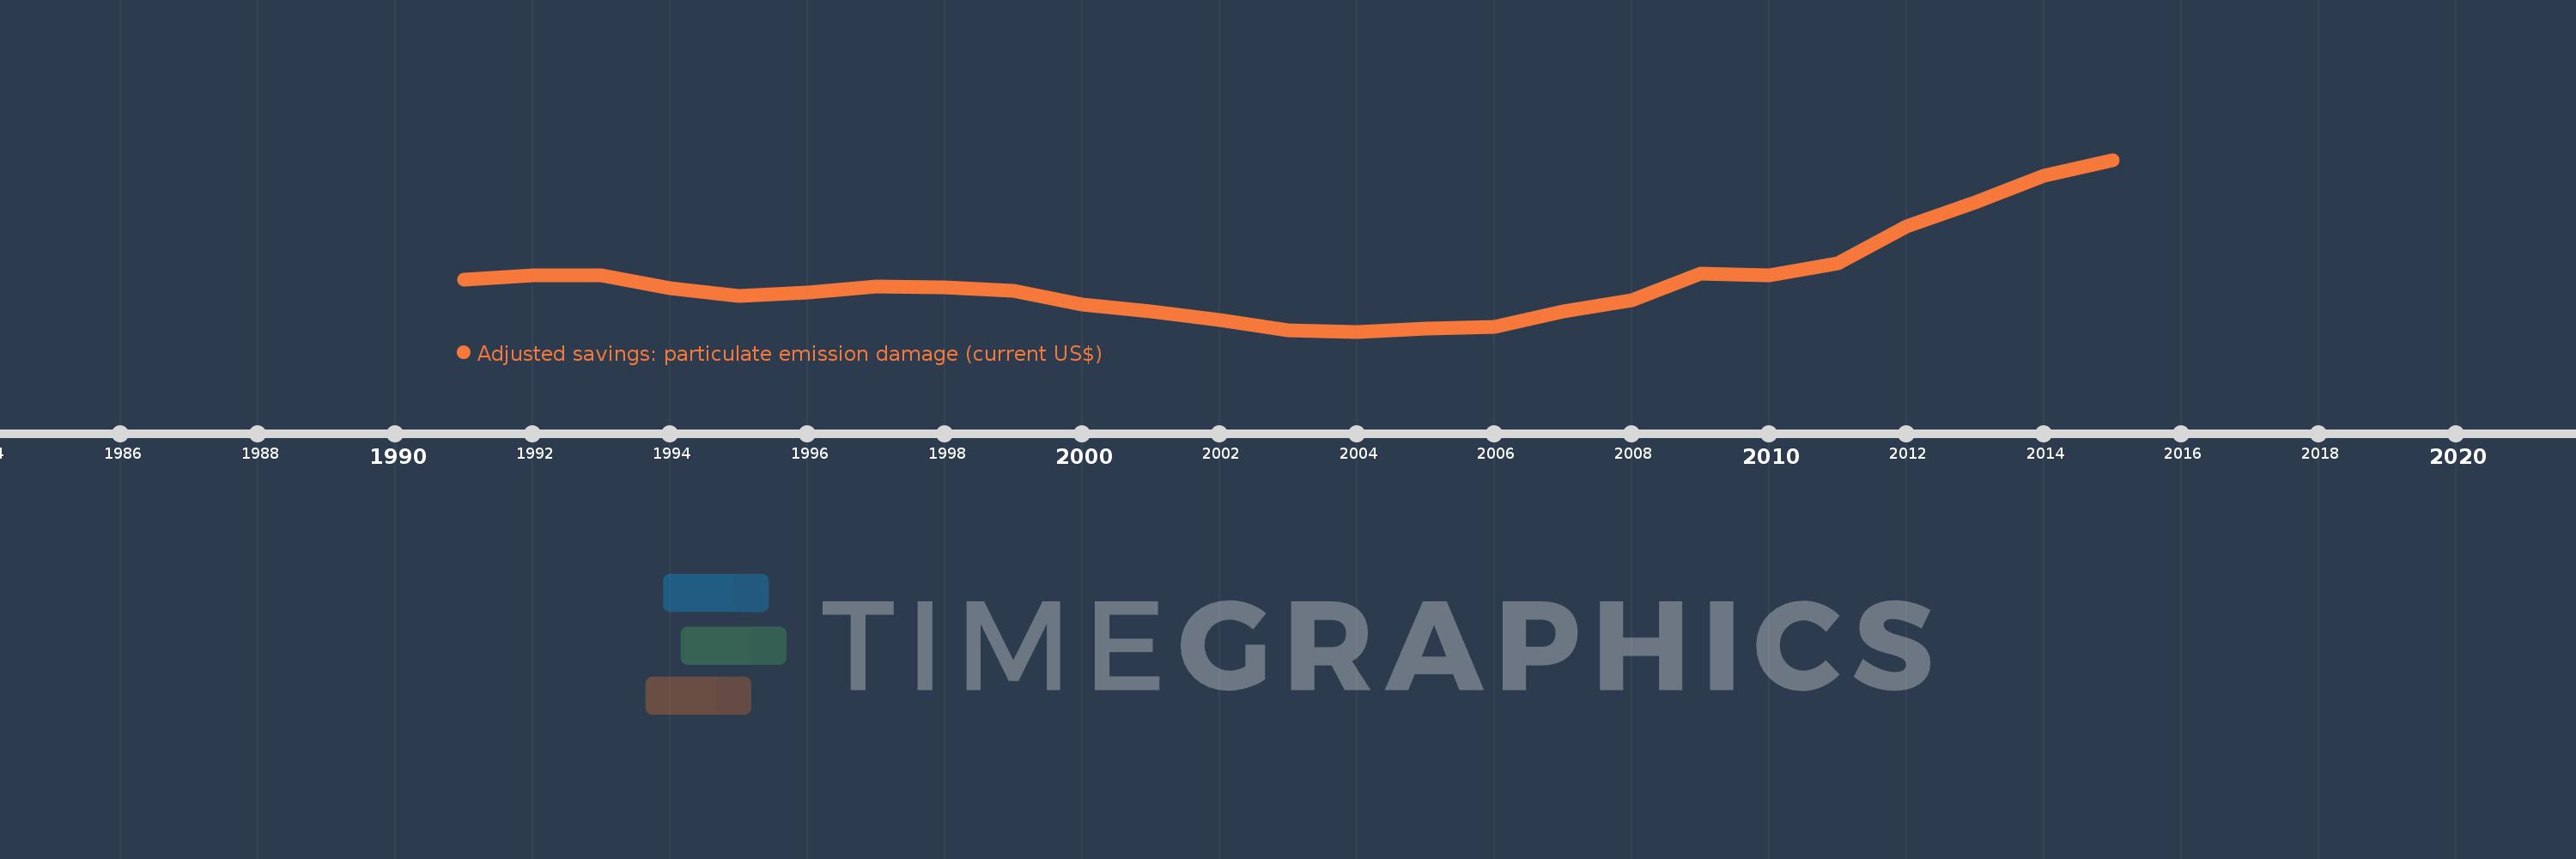
Adjusted savings: particulate emission damage (current US$)
2015,2014,2013,2012,2011,2010,2009,2008,2007,2006,2005,2004,2003,2002,2001,2000,1999,1998,1997,1996,1995,1994,1993,1992,1991
This statistics in other country:
AfghanistanAlbaniaAlgeriaAndorraAngolaAntigua and BarbudaArgentinaArmeniaAustraliaAustriaAzerbaijanBahamas, TheBahrainBangladeshBarbadosBelarusBelgiumBelizeBeninBhutanBoliviaBosnia and HerzegovinaBotswanaBrazilBrunei DarussalamBulgariaBurkina FasoBurundiCabo VerdeCambodiaCameroonCanadaCentral African RepublicChadChileChinaColombiaComorosCongo, Dem. Rep.Congo, Rep.Costa RicaCote d'IvoireCroatiaCubaCyprusCzech RepublicDenmarkDjiboutiDominicaDominican RepublicEcuadorEgypt, Arab Rep.El SalvadorEquatorial GuineaEritreaEstoniaEthiopiaFijiFinlandFranceGabonGambia, TheGeorgiaGermanyGhanaGreeceGrenadaGuatemalaGuineaGuinea-BissauGuyanaHaitiHondurasHong Kong SAR, ChinaHungaryIcelandIndiaIndonesiaIran, Islamic Rep.IraqIrelandIsraelItalyJamaicaJapanJordanKazakhstanKenyaKorea, Dem. People’s Rep.Korea, Rep.KuwaitKyrgyz RepublicLao PDRLatviaLebanonLesothoLiberiaLibyaLithuaniaLuxembourgMacao SAR, ChinaMacedonia, FYRMadagascarMalawiMalaysiaMaldivesMaliMaltaMauritaniaMauritiusMexicoMoldovaMonacoMongoliaMontenegroMoroccoMozambiqueMyanmarNamibiaNepalNetherlandsNew ZealandNicaraguaNigerNigeriaNorwayOmanPakistanPanamaPapua New GuineaParaguayPeruPhilippinesPolandPortugalPuerto RicoQatarRomaniaRussian FederationRwandaSan MarinoSao Tome and PrincipeSaudi ArabiaSenegalSerbiaSierra LeoneSingaporeSlovak RepublicSloveniaSolomon IslandsSomaliaSouth AfricaSpainSri LankaSt. Kitts and NevisSt. LuciaSt. Vincent and the GrenadinesSudanSurinameSwazilandSwedenSwitzerlandSyrian Arab RepublicTajikistanTanzaniaThailandTimor-LesteTogoTrinidad and TobagoTunisiaTurkeyTurkmenistanUgandaUkraineUnited Arab EmiratesUnited KingdomUnited StatesUruguayUzbekistanVanuatuVenezuela, RBVietnamWest Bank and GazaYemen, Rep.ZambiaZimbabwe Timeline:
This timeline shows a graph from 1991 to 2015 of Bolivia. No data until 1990. Number of actual observations by date: 25.
Source name:
World Development Indicators
Source organization:
Data on health impacts from exposure to ambient PM2.5 pollution and household air pollution are from the Global Burden of Disease 2010 study. Data are provided by the Institute for Health Metrics and Evaluation at the University of Washington.
Categories, topics:
Economy & Growth, Environment
Last updated:
apr 23, 2017
Indicators value changes by year
Minimum:
27.015 mln
jan 1, 2004
Maximum:
61.069 mln
jan 1, 2015
At the date of observation
Value
Absolute change
Change from previous value
jan 1, 1991
37.274 mln
+37.274 mln
0.0%
jan 1, 1992
38.198 mln
+923.591K
2.48%
jan 1, 1993
38.205 mln
+7.451K
0.02%
jan 1, 1994
35.627 mln
-2.578 mln
-6.75%
jan 1, 1995
34.114 mln
-1.513 mln
-4.25%
jan 1, 1996
34.783 mln
+669.362K
1.96%
jan 1, 1997
35.887 mln
+1.104 mln
3.17%
jan 1, 1998
35.819 mln
-67.572K
-0.19%
jan 1, 1999
35.064 mln
-755.592K
-2.11%
jan 1, 2000
32.462 mln
-2.602 mln
-7.42%
jan 1, 2001
31.064 mln
-1.398 mln
-4.31%
jan 1, 2002
29.293 mln
-1.771 mln
-5.7%
jan 1, 2003
27.285 mln
-2.008 mln
-6.85%
jan 1, 2004
27.015 mln
-270.412K
-0.99%
jan 1, 2005
27.634 mln
+619.348K
2.29%
jan 1, 2006
27.987 mln
+352.629K
1.28%
jan 1, 2007
31.029 mln
+3.043 mln
10.87%
jan 1, 2008
33.249 mln
+2.22 mln
7.15%
jan 1, 2009
38.542 mln
+5.292 mln
15.92%
jan 1, 2010
38.227 mln
-314.622K
-0.82%
jan 1, 2011
40.531 mln
+2.304 mln
6.03%
jan 1, 2012
47.817 mln
+7.286 mln
17.98%
jan 1, 2013
52.607 mln
+4.79 mln
10.02%
jan 1, 2014
57.861 mln
+5.253 mln
9.99%
jan 1, 2015
61.069 mln
+3.208 mln
5.54%
Ranking of countries by current statistics by years


Comments: