29
/
en
AIzaSyAYiBZKx7MnpbEhh9jyipgxe19OcubqV5w
April 1, 2024
64872
Albania
ALB
true
2
1
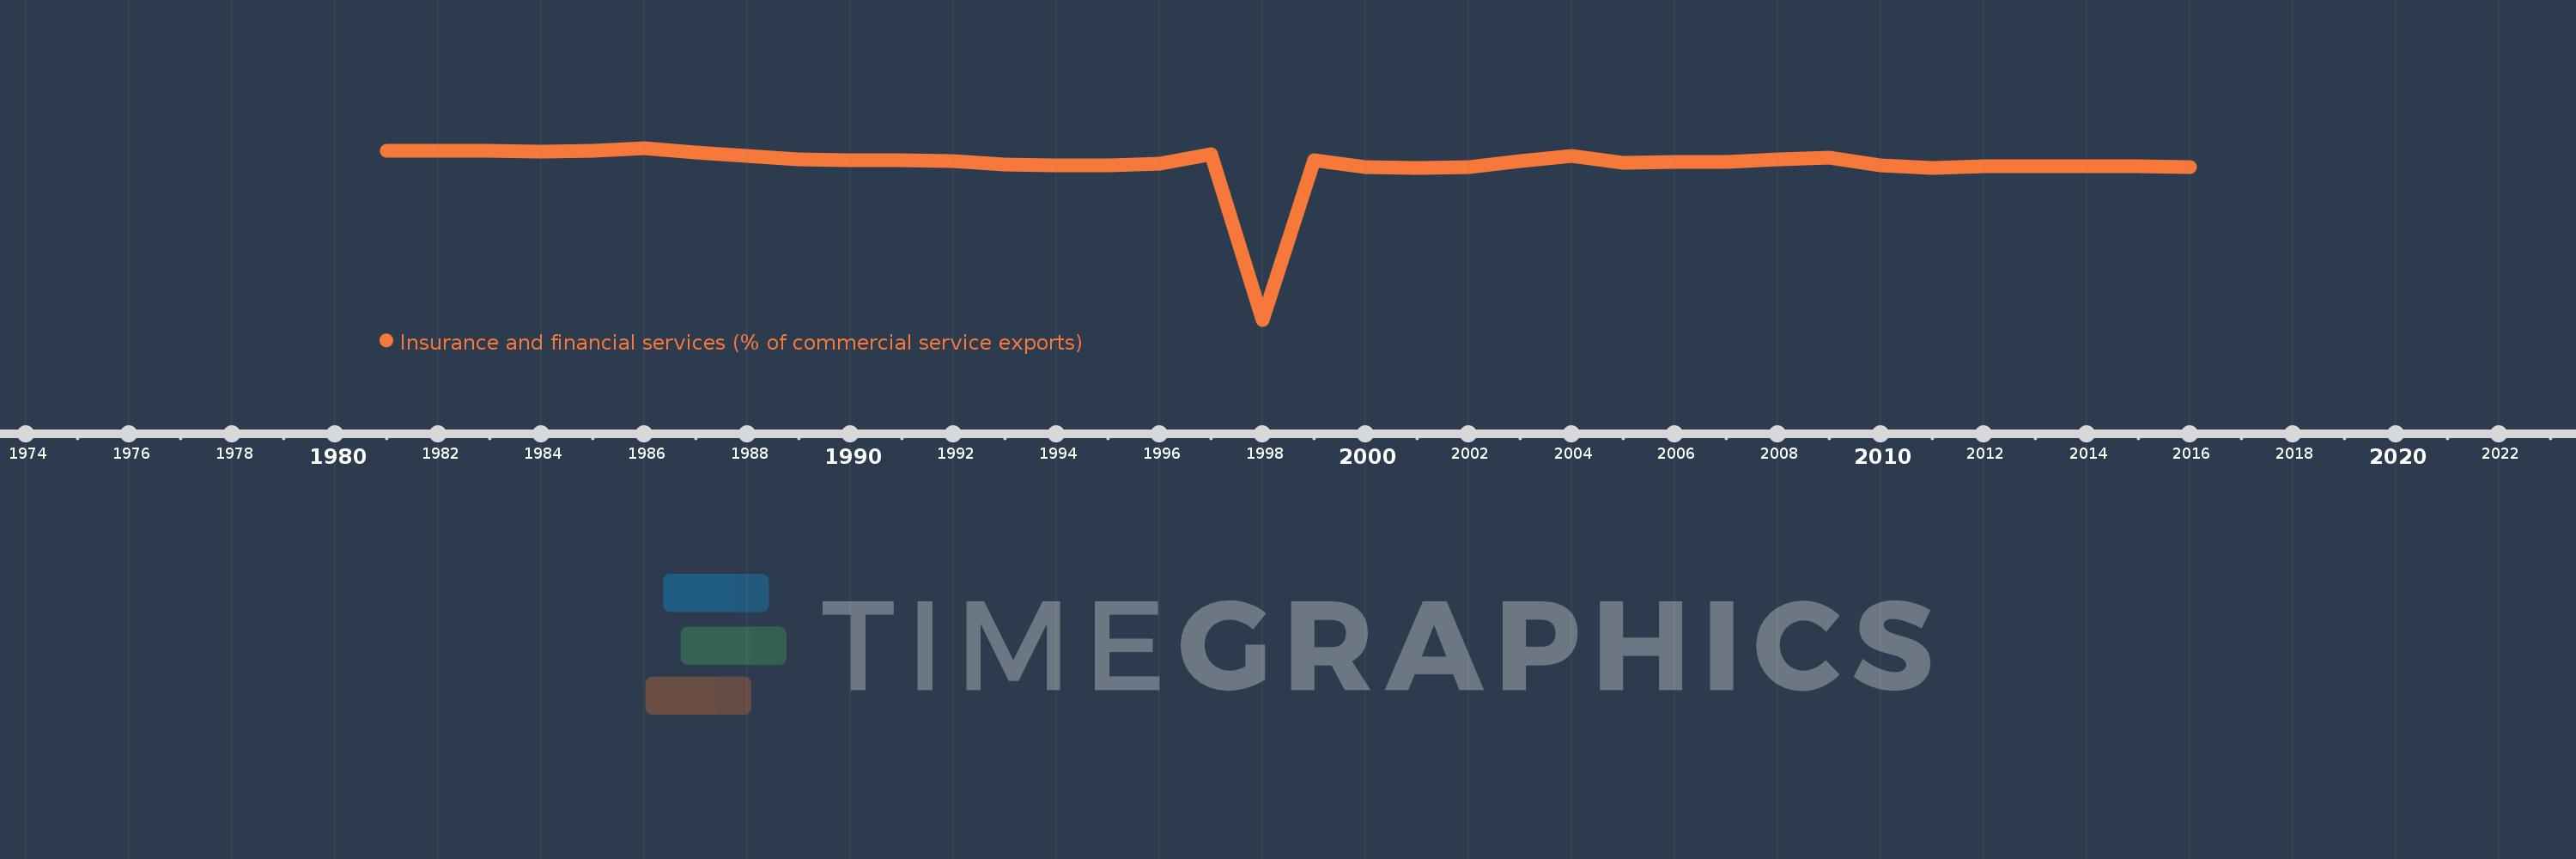
Insurance and financial services (% of commercial service exports)
2016,2015,2014,2013,2012,2011,2010,2009,2008,2007,2006,2005,2004,2003,2002,2001,2000,1999,1998,1997,1996,1995,1994,1993,1992,1991,1990,1989,1988,1987,1986,1985,1984,1983,1982,1981
This statistics in other country:
AfghanistanAlbaniaAlgeriaAngolaAntigua and BarbudaArab WorldArgentinaArmeniaArubaAustraliaAustriaAzerbaijanBahrainBangladeshBarbadosBelarusBelgiumBelizeBeninBermudaBhutanBoliviaBosnia and HerzegovinaBotswanaBrazilBrunei DarussalamBulgariaBurkina FasoBurundiCabo VerdeCambodiaCameroonCanadaCaribbean small statesCentral African RepublicCentral Europe and the BalticsChadChileChinaColombiaComorosCongo, Dem. Rep.Congo, Rep.Costa RicaCote d'IvoireCroatiaCuracaoCyprusCzech RepublicDenmarkDominicaDominican RepublicEarly-demographic dividendEast Asia & PacificEast Asia & Pacific (excluding high income)East Asia & Pacific (IDA & IBRD countries)EcuadorEgypt, Arab Rep.El SalvadorEritreaEstoniaEthiopiaEuro areaEurope & Central AsiaEurope & Central Asia (excluding high income)Europe & Central Asia (IDA & IBRD countries)European UnionFaroe IslandsFijiFinlandFragile and conflict affected situationsFranceFrench PolynesiaGabonGambia, TheGeorgiaGermanyGhanaGreeceGrenadaGuatemalaGuineaGuinea-BissauGuyanaHaitiHeavily indebted poor countries (HIPC)High incomeHondurasHong Kong SAR, ChinaHungaryIBRD onlyIcelandIDA & IBRD totalIDA onlyIDA totalIndiaIndonesiaIran, Islamic Rep.IraqIrelandIsraelItalyJamaicaJapanJordanKazakhstanKenyaKiribatiKorea, Rep.KosovoKuwaitKyrgyz RepublicLao PDRLate-demographic dividendLatin America & Caribbean Latin America & Caribbean (excluding high income)Latin America & the Caribbean (IDA & IBRD countries)LatviaLeast developed countries: UN classificationLebanonLesothoLiberiaLibyaLithuaniaLow & middle incomeLow incomeLower middle incomeLuxembourgMacao SAR, ChinaMacedonia, FYRMadagascarMalawiMalaysiaMaldivesMaliMaltaMauritaniaMauritiusMexicoMiddle East & North AfricaMiddle East & North Africa (excluding high income)Middle East & North Africa (IDA & IBRD countries)Middle incomeMoldovaMongoliaMontenegroMoroccoMozambiqueMyanmarNamibiaNepalNetherlandsNew CaledoniaNew ZealandNicaraguaNigerNigeriaNorth AmericaNorwayOECD membersOmanOther small statesPacific island small statesPakistanPalauPanamaPapua New GuineaParaguayPeruPhilippinesPolandPortugalPost-demographic dividendPre-demographic dividendQatarRomaniaRussian FederationRwandaSamoaSao Tome and PrincipeSaudi ArabiaSenegalSerbiaSeychellesSierra LeoneSingaporeSint Maarten (Dutch part)Slovak RepublicSloveniaSmall statesSolomon IslandsSouth AfricaSouth AsiaSouth Asia (IDA & IBRD)South SudanSpainSri LankaSt. Kitts and NevisSt. LuciaSt. Vincent and the GrenadinesSub-Saharan Africa Sub-Saharan Africa (excluding high income)Sub-Saharan Africa (IDA & IBRD countries)SudanSurinameSwazilandSwedenSwitzerlandSyrian Arab RepublicTajikistanTanzaniaThailandTimor-LesteTogoTongaTrinidad and TobagoTunisiaTurkeyTuvaluUgandaUkraineUnited KingdomUnited StatesUpper middle incomeUruguayVanuatuVenezuela, RBWest Bank and GazaWorldZambiaZimbabwe Timeline:
This timeline shows a graph from 1981 to 2016 of Albania. No data until 1980. Number of actual observations by date: 36.
Source name:
World Development Indicators
Source organization:
International Monetary Fund, Balance of Payments Statistics Yearbook and data files.
Categories, topics:
Private Sector, Trade
Last updated:
apr 23, 2017
Indicators value changes by year
Minimum:
-40.373
jan 1, 1998
At the date of observation
Value
Absolute change
Change from previous value
jan 1, 1981
4.679
+4.679
0.0%
jan 1, 1982
4.75
+0.071
1.52%
jan 1, 1983
4.697
-0.053
-1.12%
jan 1, 1984
4.538
-0.159
-3.37%
jan 1, 1985
4.675
+0.137
3.02%
jan 1, 1986
5.467
+0.791
16.93%
jan 1, 1987
4.25
-1.217
-22.26%
jan 1, 1988
3.408
-0.842
-19.81%
jan 1, 1989
2.466
-0.942
-27.64%
jan 1, 1990
2.189
-0.277
-11.24%
jan 1, 1991
2.222
+0.033
1.52%
jan 1, 1992
1.957
-0.266
-11.96%
jan 1, 1993
1.058
-0.898
-45.91%
jan 1, 1994
0.861
-0.198
-18.67%
jan 1, 1995
0.916
+0.055
6.43%
jan 1, 1996
1.384
+0.468
51.14%
jan 1, 1997
3.827
+2.443
176.45%
jan 1, 1998
-40.373
-44.2
-1.15K%
jan 1, 1999
2.237
+42.61
-105.54%
jan 1, 2000
0.32
-1.918
-85.71%
jan 1, 2001
0.204
-0.115
-36.04%
jan 1, 2002
0.334
+0.129
63.27%
jan 1, 2003
1.979
+1.646
493.1%
jan 1, 2004
3.293
+1.314
66.39%
jan 1, 2005
1.592
-1.701
-51.65%
jan 1, 2006
1.729
+0.136
8.55%
jan 1, 2007
1.814
+0.086
4.96%
jan 1, 2008
2.372
+0.557
30.72%
jan 1, 2009
2.785
+0.414
17.45%
jan 1, 2010
0.921
-1.864
-66.93%
jan 1, 2011
0.181
-0.741
-80.39%
jan 1, 2012
0.656
+0.475
263.14%
jan 1, 2013
0.634
-0.022
-3.37%
jan 1, 2014
0.559
-0.075
-11.8%
jan 1, 2015
0.635
+0.076
13.55%
jan 1, 2016
0.257
-0.378
-59.58%
Ranking of countries by current statistics by years


Comments: