29
/
en
AIzaSyAYiBZKx7MnpbEhh9jyipgxe19OcubqV5w
April 1, 2024
130611
Ethiopia
ETH
true
2
1
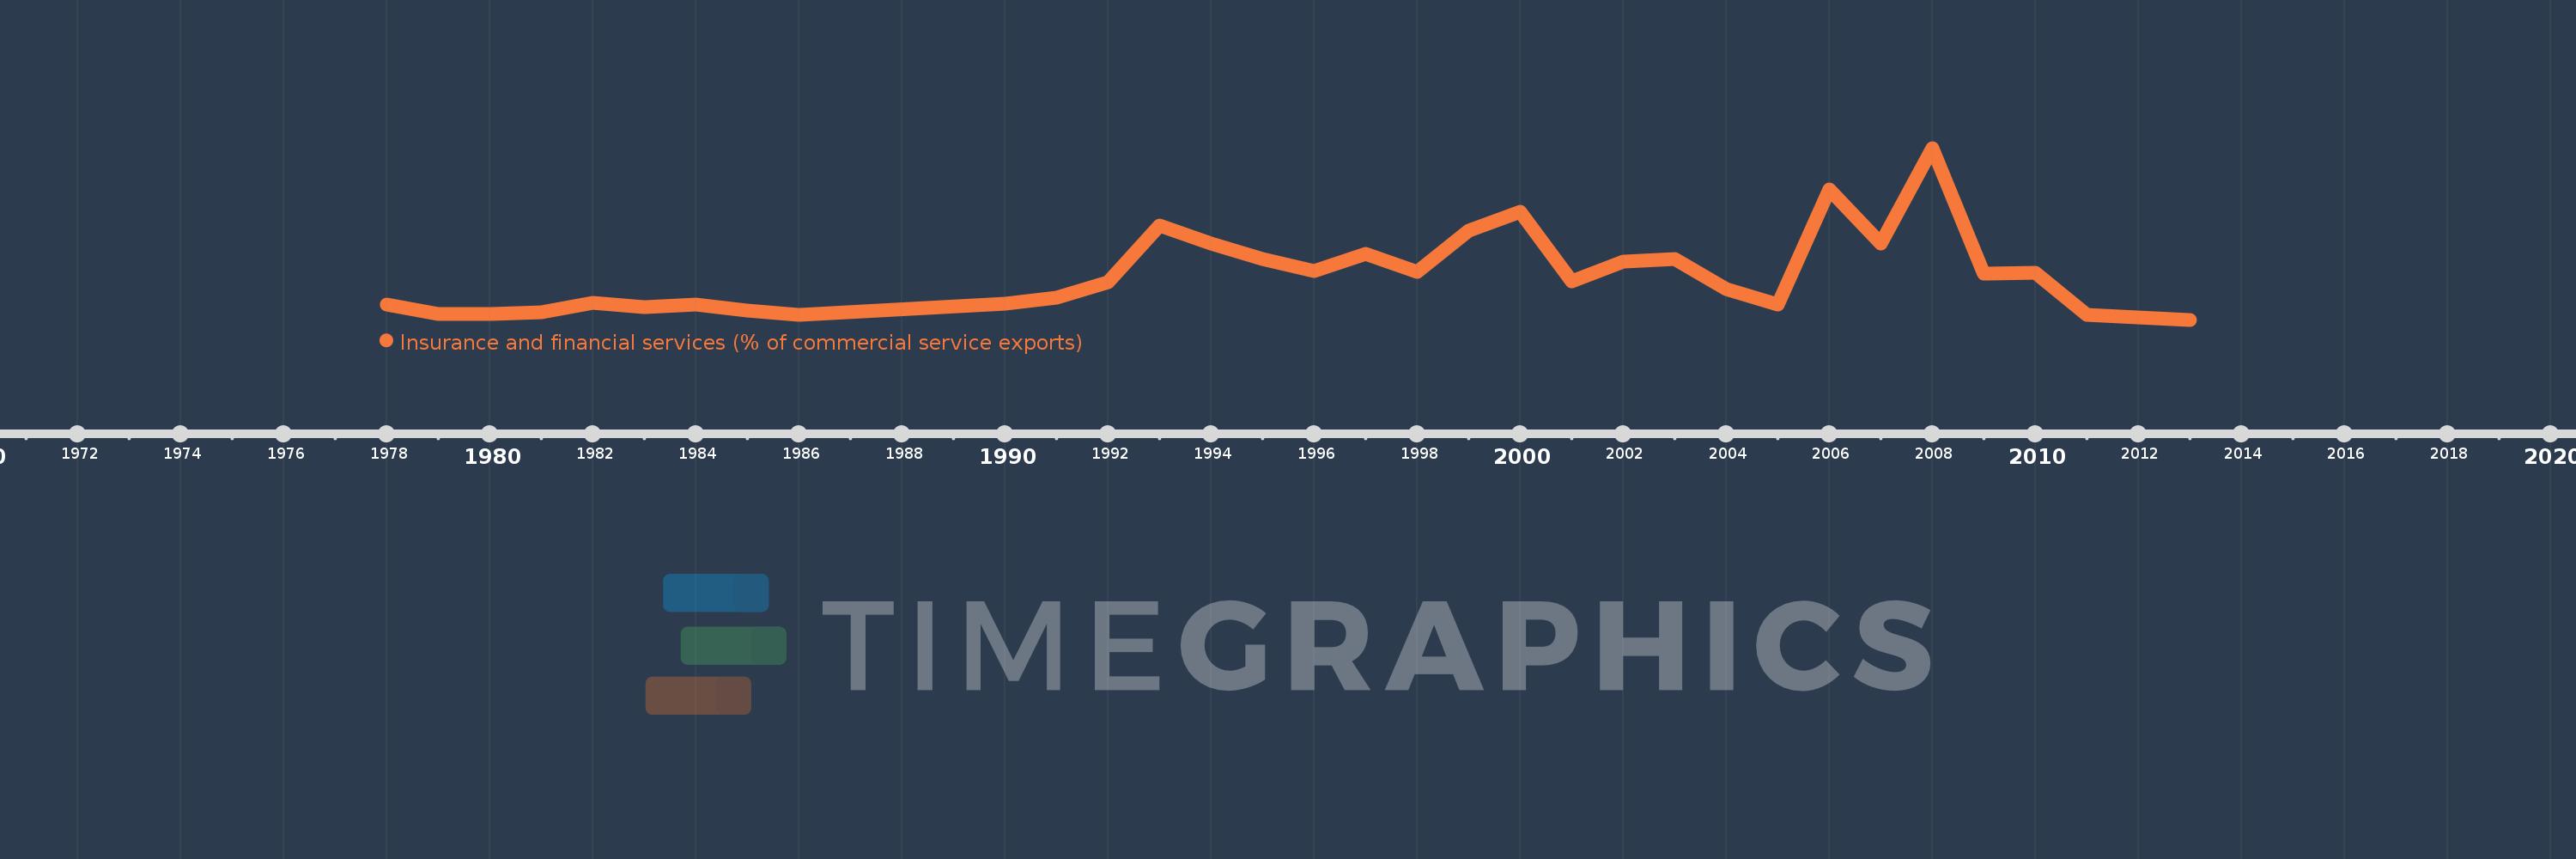
Insurance and financial services (% of commercial service exports)
2013,2012,2011,2010,2009,2008,2007,2006,2005,2004,2003,2002,2001,2000,1999,1998,1997,1996,1995,1994,1993,1992,1991,1990,1986,1985,1984,1983,1982,1981,1980,1979,1978
This statistics in other country:
AfghanistanAlbaniaAlgeriaAngolaAntigua and BarbudaArab WorldArgentinaArmeniaArubaAustraliaAustriaAzerbaijanBahrainBangladeshBarbadosBelarusBelgiumBelizeBeninBermudaBhutanBoliviaBosnia and HerzegovinaBotswanaBrazilBrunei DarussalamBulgariaBurkina FasoBurundiCabo VerdeCambodiaCameroonCanadaCaribbean small statesCentral African RepublicCentral Europe and the BalticsChadChileChinaColombiaComorosCongo, Dem. Rep.Congo, Rep.Costa RicaCote d'IvoireCroatiaCuracaoCyprusCzech RepublicDenmarkDominicaDominican RepublicEarly-demographic dividendEast Asia & PacificEast Asia & Pacific (excluding high income)East Asia & Pacific (IDA & IBRD countries)EcuadorEgypt, Arab Rep.El SalvadorEritreaEstoniaEthiopiaEuro areaEurope & Central AsiaEurope & Central Asia (excluding high income)Europe & Central Asia (IDA & IBRD countries)European UnionFaroe IslandsFijiFinlandFragile and conflict affected situationsFranceFrench PolynesiaGabonGambia, TheGeorgiaGermanyGhanaGreeceGrenadaGuatemalaGuineaGuinea-BissauGuyanaHaitiHeavily indebted poor countries (HIPC)High incomeHondurasHong Kong SAR, ChinaHungaryIBRD onlyIcelandIDA & IBRD totalIDA onlyIDA totalIndiaIndonesiaIran, Islamic Rep.IraqIrelandIsraelItalyJamaicaJapanJordanKazakhstanKenyaKiribatiKorea, Rep.KosovoKuwaitKyrgyz RepublicLao PDRLate-demographic dividendLatin America & Caribbean Latin America & Caribbean (excluding high income)Latin America & the Caribbean (IDA & IBRD countries)LatviaLeast developed countries: UN classificationLebanonLesothoLiberiaLibyaLithuaniaLow & middle incomeLow incomeLower middle incomeLuxembourgMacao SAR, ChinaMacedonia, FYRMadagascarMalawiMalaysiaMaldivesMaliMaltaMauritaniaMauritiusMexicoMiddle East & North AfricaMiddle East & North Africa (excluding high income)Middle East & North Africa (IDA & IBRD countries)Middle incomeMoldovaMongoliaMontenegroMoroccoMozambiqueMyanmarNamibiaNepalNetherlandsNew CaledoniaNew ZealandNicaraguaNigerNigeriaNorth AmericaNorwayOECD membersOmanOther small statesPacific island small statesPakistanPalauPanamaPapua New GuineaParaguayPeruPhilippinesPolandPortugalPost-demographic dividendPre-demographic dividendQatarRomaniaRussian FederationRwandaSamoaSao Tome and PrincipeSaudi ArabiaSenegalSerbiaSeychellesSierra LeoneSingaporeSint Maarten (Dutch part)Slovak RepublicSloveniaSmall statesSolomon IslandsSouth AfricaSouth AsiaSouth Asia (IDA & IBRD)South SudanSpainSri LankaSt. Kitts and NevisSt. LuciaSt. Vincent and the GrenadinesSub-Saharan Africa Sub-Saharan Africa (excluding high income)Sub-Saharan Africa (IDA & IBRD countries)SudanSurinameSwazilandSwedenSwitzerlandSyrian Arab RepublicTajikistanTanzaniaThailandTimor-LesteTogoTongaTrinidad and TobagoTunisiaTurkeyTuvaluUgandaUkraineUnited KingdomUnited StatesUpper middle incomeUruguayVanuatuVenezuela, RBWest Bank and GazaWorldZambiaZimbabwe Timeline:
This timeline shows a graph from 1978 to 2013 of Ethiopia. No data until 1977. Number of actual observations by date: 33.
Source name:
World Development Indicators
Source organization:
International Monetary Fund, Balance of Payments Statistics Yearbook and data files.
Categories, topics:
Private Sector, Trade
Last updated:
apr 23, 2017
Indicators value changes by year
At the date of observation
Value
Absolute change
Change from previous value
jan 1, 1979
0.225
-0.274
-54.9%
jan 1, 1980
0.224
-0.002
-0.75%
jan 1, 1981
0.279
+0.055
24.82%
jan 1, 1982
0.567
+0.288
103.06%
jan 1, 1983
0.419
-0.148
-26.06%
jan 1, 1984
0.493
+0.074
17.7%
jan 1, 1985
0.327
-0.166
-33.62%
jan 1, 1986
0.193
-0.134
-41.0%
jan 1, 1990
0.535
+0.342
177.19%
jan 1, 1991
0.704
+0.169
31.56%
jan 1, 1992
1.178
+0.473
67.17%
jan 1, 1993
2.89
+1.712
145.4%
jan 1, 1994
2.348
-0.542
-18.77%
jan 1, 1995
1.884
-0.463
-19.73%
jan 1, 1996
1.502
-0.383
-20.31%
jan 1, 1997
2.029
+0.527
35.09%
jan 1, 1998
1.474
-0.554
-27.33%
jan 1, 1999
2.728
+1.254
85.07%
jan 1, 2000
3.304
+0.575
21.09%
jan 1, 2001
1.212
-2.091
-63.3%
jan 1, 2002
1.796
+0.583
48.09%
jan 1, 2003
1.865
+0.069
3.86%
jan 1, 2004
0.982
-0.883
-47.33%
jan 1, 2005
0.5
-0.482
-49.12%
jan 1, 2006
3.957
+3.457
691.8%
jan 1, 2007
2.349
-1.607
-40.62%
jan 1, 2008
5.214
+2.864
121.92%
jan 1, 2009
1.447
-3.767
-72.25%
jan 1, 2010
1.462
+0.015
1.03%
jan 1, 2011
0.204
-1.258
-86.07%
jan 1, 2012
0.106
-0.097
-47.85%
jan 1, 2013
0.047
-0.059
-55.54%
Ranking of countries by current statistics by years


Comments: