29
/
en
AIzaSyAYiBZKx7MnpbEhh9jyipgxe19OcubqV5w
April 1, 2024
36673
IBRD only
IBD
false
2
1
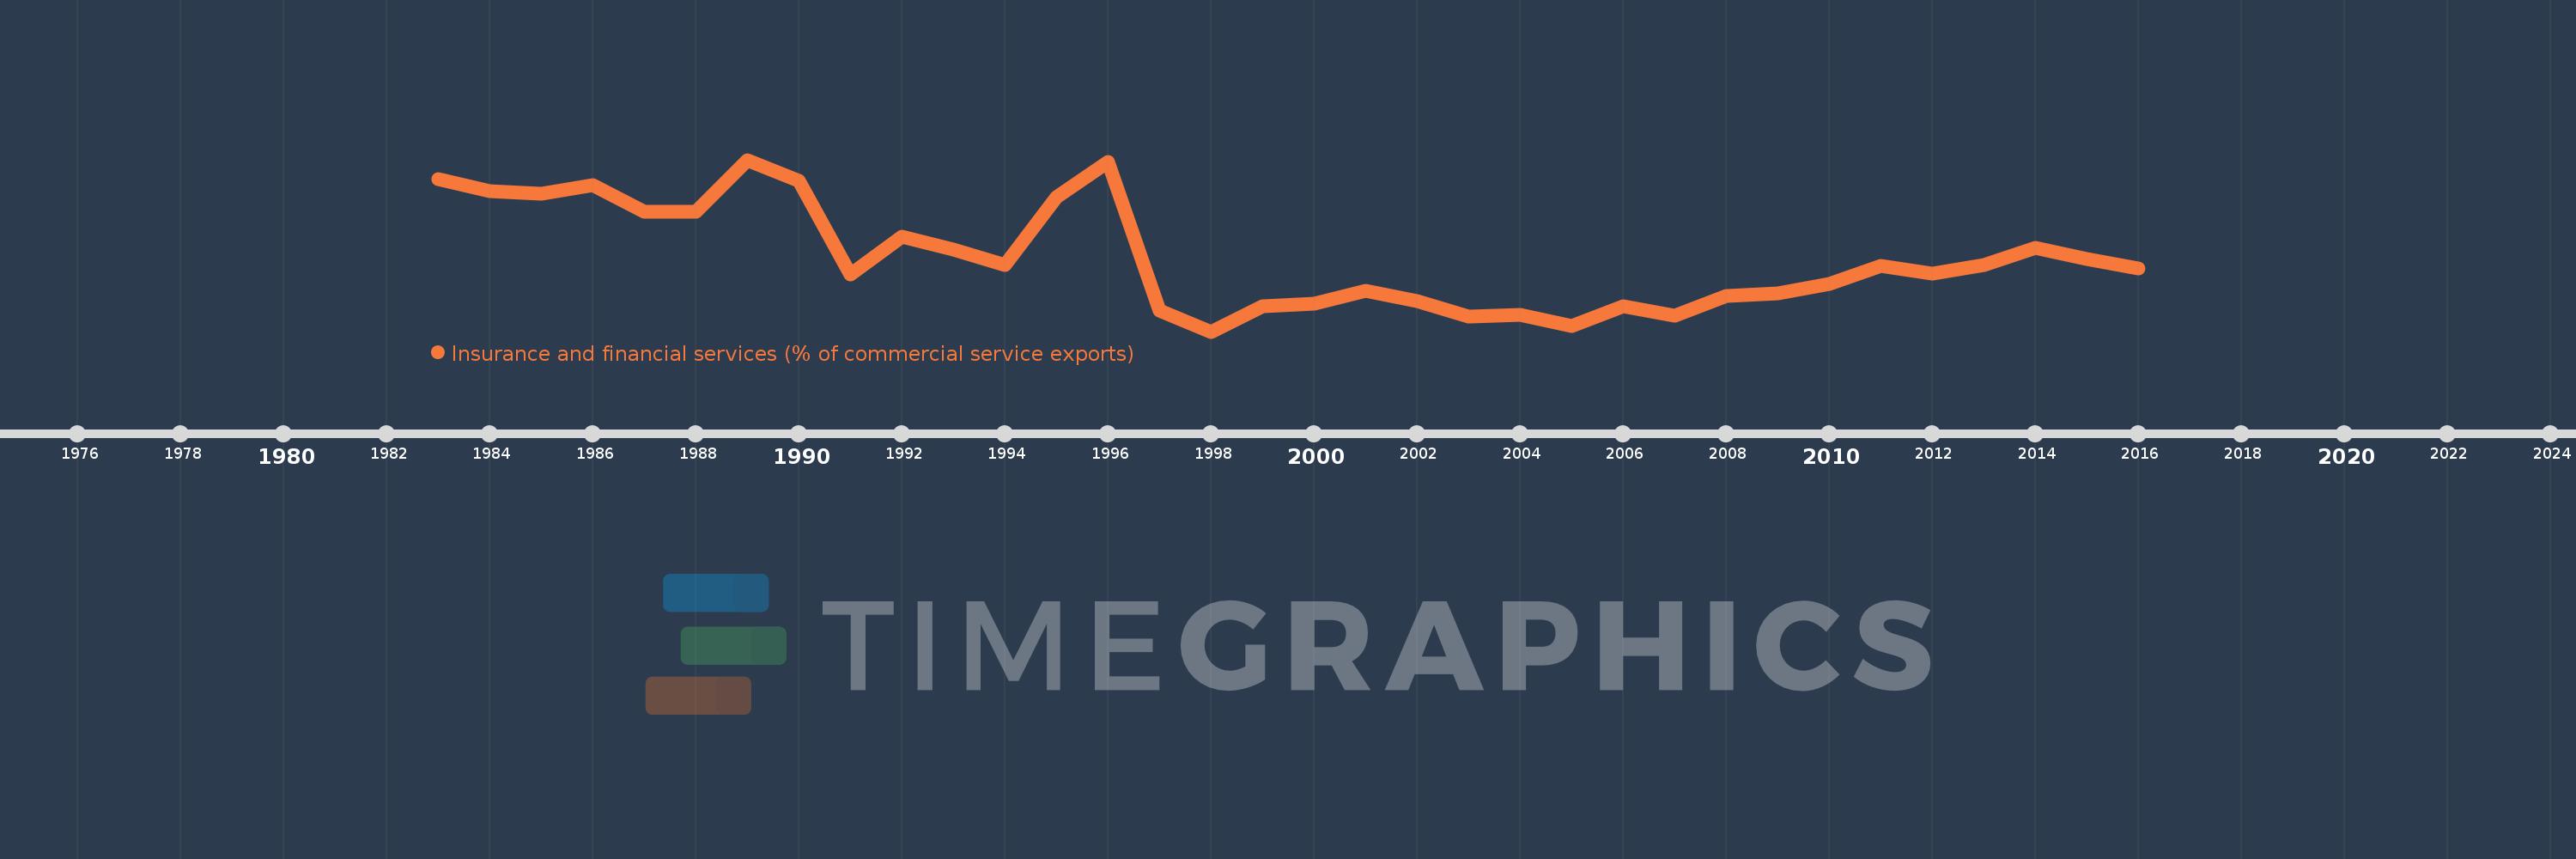
Insurance and financial services (% of commercial service exports)
2016,2015,2014,2013,2012,2011,2010,2009,2008,2007,2006,2005,2004,2003,2002,2001,2000,1999,1998,1997,1996,1995,1994,1993,1992,1991,1990,1989,1988,1987,1986,1985,1984,1983
This statistics in other country:
AfghanistanAlbaniaAlgeriaAngolaAntigua and BarbudaArab WorldArgentinaArmeniaArubaAustraliaAustriaAzerbaijanBahrainBangladeshBarbadosBelarusBelgiumBelizeBeninBermudaBhutanBoliviaBosnia and HerzegovinaBotswanaBrazilBrunei DarussalamBulgariaBurkina FasoBurundiCabo VerdeCambodiaCameroonCanadaCaribbean small statesCentral African RepublicCentral Europe and the BalticsChadChileChinaColombiaComorosCongo, Dem. Rep.Congo, Rep.Costa RicaCote d'IvoireCroatiaCuracaoCyprusCzech RepublicDenmarkDominicaDominican RepublicEarly-demographic dividendEast Asia & PacificEast Asia & Pacific (excluding high income)East Asia & Pacific (IDA & IBRD countries)EcuadorEgypt, Arab Rep.El SalvadorEritreaEstoniaEthiopiaEuro areaEurope & Central AsiaEurope & Central Asia (excluding high income)Europe & Central Asia (IDA & IBRD countries)European UnionFaroe IslandsFijiFinlandFragile and conflict affected situationsFranceFrench PolynesiaGabonGambia, TheGeorgiaGermanyGhanaGreeceGrenadaGuatemalaGuineaGuinea-BissauGuyanaHaitiHeavily indebted poor countries (HIPC)High incomeHondurasHong Kong SAR, ChinaHungaryIBRD onlyIcelandIDA & IBRD totalIDA onlyIDA totalIndiaIndonesiaIran, Islamic Rep.IraqIrelandIsraelItalyJamaicaJapanJordanKazakhstanKenyaKiribatiKorea, Rep.KosovoKuwaitKyrgyz RepublicLao PDRLate-demographic dividendLatin America & Caribbean Latin America & Caribbean (excluding high income)Latin America & the Caribbean (IDA & IBRD countries)LatviaLeast developed countries: UN classificationLebanonLesothoLiberiaLibyaLithuaniaLow & middle incomeLow incomeLower middle incomeLuxembourgMacao SAR, ChinaMacedonia, FYRMadagascarMalawiMalaysiaMaldivesMaliMaltaMauritaniaMauritiusMexicoMiddle East & North AfricaMiddle East & North Africa (excluding high income)Middle East & North Africa (IDA & IBRD countries)Middle incomeMoldovaMongoliaMontenegroMoroccoMozambiqueMyanmarNamibiaNepalNetherlandsNew CaledoniaNew ZealandNicaraguaNigerNigeriaNorth AmericaNorwayOECD membersOmanOther small statesPacific island small statesPakistanPalauPanamaPapua New GuineaParaguayPeruPhilippinesPolandPortugalPost-demographic dividendPre-demographic dividendQatarRomaniaRussian FederationRwandaSamoaSao Tome and PrincipeSaudi ArabiaSenegalSerbiaSeychellesSierra LeoneSingaporeSint Maarten (Dutch part)Slovak RepublicSloveniaSmall statesSolomon IslandsSouth AfricaSouth AsiaSouth Asia (IDA & IBRD)South SudanSpainSri LankaSt. Kitts and NevisSt. LuciaSt. Vincent and the GrenadinesSub-Saharan Africa Sub-Saharan Africa (excluding high income)Sub-Saharan Africa (IDA & IBRD countries)SudanSurinameSwazilandSwedenSwitzerlandSyrian Arab RepublicTajikistanTanzaniaThailandTimor-LesteTogoTongaTrinidad and TobagoTunisiaTurkeyTuvaluUgandaUkraineUnited KingdomUnited StatesUpper middle incomeUruguayVanuatuVenezuela, RBWest Bank and GazaWorldZambiaZimbabwe Timeline:
This timeline shows a graph from 1983 to 2016 of IBRD only. No data until 1982. Number of actual observations by date: 34.
Source name:
World Development Indicators
Source organization:
International Monetary Fund, Balance of Payments Statistics Yearbook and data files.
Categories, topics:
Private Sector, Trade
Last updated:
apr 23, 2017
Indicators value changes by year
At the date of observation
Value
Absolute change
Change from previous value
jan 1, 1983
6.259
+6.259
0.0%
jan 1, 1984
5.929
-0.33
-5.28%
jan 1, 1985
5.868
-0.06
-1.02%
jan 1, 1986
6.087
+0.219
3.73%
jan 1, 1987
5.371
-0.716
-11.77%
jan 1, 1988
5.37
-0.001
-0.02%
jan 1, 1989
6.788
+1.419
26.42%
jan 1, 1990
6.214
-0.575
-8.46%
jan 1, 1991
3.66
-2.554
-41.1%
jan 1, 1992
4.683
+1.023
27.94%
jan 1, 1993
4.333
-0.35
-7.46%
jan 1, 1994
3.925
-0.408
-9.42%
jan 1, 1995
5.768
+1.843
46.96%
jan 1, 1996
6.725
+0.957
16.6%
jan 1, 1997
2.673
-4.052
-60.25%
jan 1, 1998
2.104
-0.57
-21.31%
jan 1, 1999
2.79
+0.686
32.6%
jan 1, 2000
2.872
+0.083
2.97%
jan 1, 2001
3.21
+0.338
11.77%
jan 1, 2002
2.928
-0.282
-8.8%
jan 1, 2003
2.514
-0.414
-14.14%
jan 1, 2004
2.556
+0.042
1.67%
jan 1, 2005
2.248
-0.308
-12.07%
jan 1, 2006
2.8
+0.552
24.56%
jan 1, 2007
2.544
-0.256
-9.15%
jan 1, 2008
3.086
+0.542
21.31%
jan 1, 2009
3.149
+0.064
2.07%
jan 1, 2010
3.398
+0.249
7.9%
jan 1, 2011
3.905
+0.507
14.93%
jan 1, 2012
3.689
-0.217
-5.55%
jan 1, 2013
3.92
+0.232
6.28%
jan 1, 2014
4.376
+0.456
11.63%
jan 1, 2015
4.088
-0.289
-6.6%
jan 1, 2016
3.836
-0.252
-6.16%
Ranking of countries by current statistics by years


Comments: