29
/
en
AIzaSyAYiBZKx7MnpbEhh9jyipgxe19OcubqV5w
April 1, 2024
268141
Tunisia
TUN
true
2
1
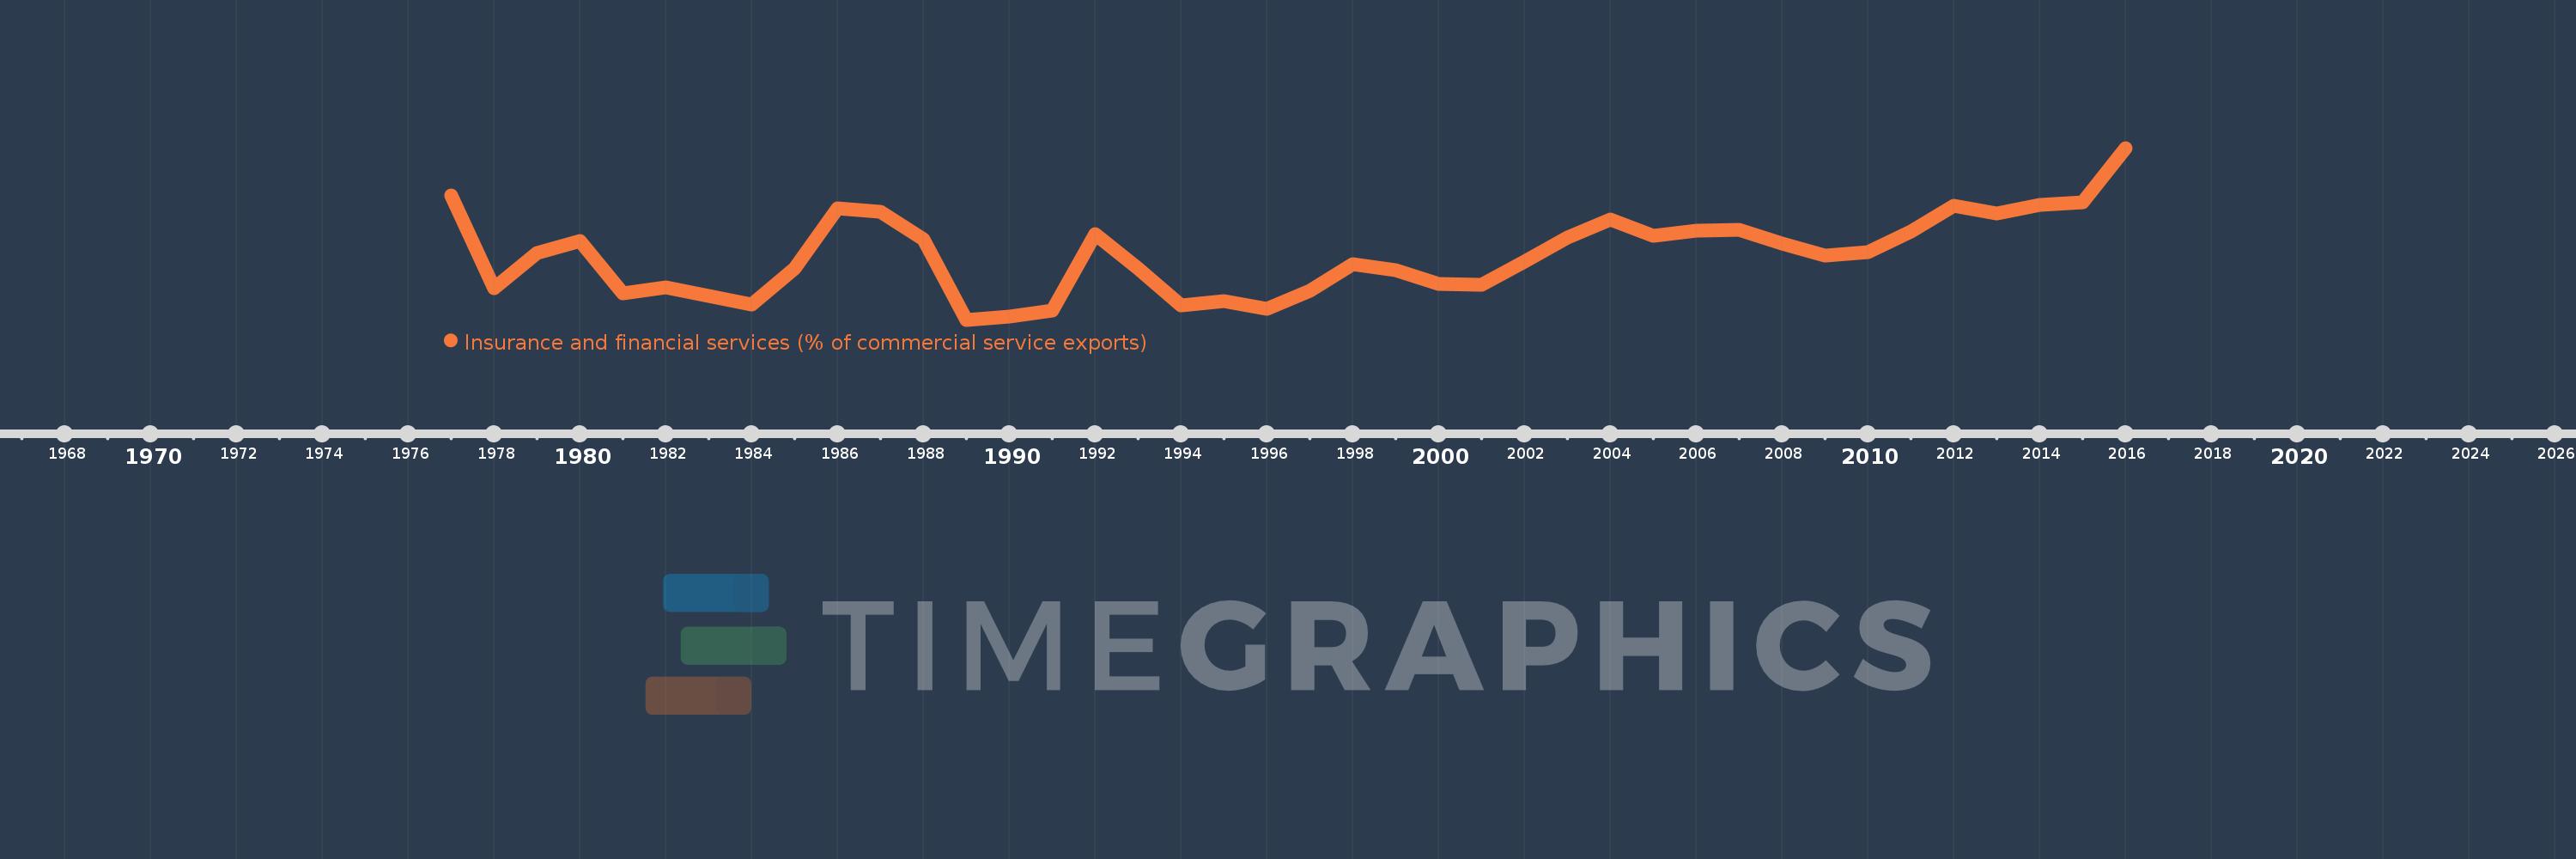
Insurance and financial services (% of commercial service exports)
2016,2015,2014,2013,2012,2011,2010,2009,2008,2007,2006,2005,2004,2003,2002,2001,2000,1999,1998,1997,1996,1995,1994,1993,1992,1991,1990,1989,1988,1987,1986,1985,1984,1983,1982,1981,1980,1979,1978,1977
This statistics in other country:
AfghanistanAlbaniaAlgeriaAngolaAntigua and BarbudaArab WorldArgentinaArmeniaArubaAustraliaAustriaAzerbaijanBahrainBangladeshBarbadosBelarusBelgiumBelizeBeninBermudaBhutanBoliviaBosnia and HerzegovinaBotswanaBrazilBrunei DarussalamBulgariaBurkina FasoBurundiCabo VerdeCambodiaCameroonCanadaCaribbean small statesCentral African RepublicCentral Europe and the BalticsChadChileChinaColombiaComorosCongo, Dem. Rep.Congo, Rep.Costa RicaCote d'IvoireCroatiaCuracaoCyprusCzech RepublicDenmarkDominicaDominican RepublicEarly-demographic dividendEast Asia & PacificEast Asia & Pacific (excluding high income)East Asia & Pacific (IDA & IBRD countries)EcuadorEgypt, Arab Rep.El SalvadorEritreaEstoniaEthiopiaEuro areaEurope & Central AsiaEurope & Central Asia (excluding high income)Europe & Central Asia (IDA & IBRD countries)European UnionFaroe IslandsFijiFinlandFragile and conflict affected situationsFranceFrench PolynesiaGabonGambia, TheGeorgiaGermanyGhanaGreeceGrenadaGuatemalaGuineaGuinea-BissauGuyanaHaitiHeavily indebted poor countries (HIPC)High incomeHondurasHong Kong SAR, ChinaHungaryIBRD onlyIcelandIDA & IBRD totalIDA onlyIDA totalIndiaIndonesiaIran, Islamic Rep.IraqIrelandIsraelItalyJamaicaJapanJordanKazakhstanKenyaKiribatiKorea, Rep.KosovoKuwaitKyrgyz RepublicLao PDRLate-demographic dividendLatin America & Caribbean Latin America & Caribbean (excluding high income)Latin America & the Caribbean (IDA & IBRD countries)LatviaLeast developed countries: UN classificationLebanonLesothoLiberiaLibyaLithuaniaLow & middle incomeLow incomeLower middle incomeLuxembourgMacao SAR, ChinaMacedonia, FYRMadagascarMalawiMalaysiaMaldivesMaliMaltaMauritaniaMauritiusMexicoMiddle East & North AfricaMiddle East & North Africa (excluding high income)Middle East & North Africa (IDA & IBRD countries)Middle incomeMoldovaMongoliaMontenegroMoroccoMozambiqueMyanmarNamibiaNepalNetherlandsNew CaledoniaNew ZealandNicaraguaNigerNigeriaNorth AmericaNorwayOECD membersOmanOther small statesPacific island small statesPakistanPalauPanamaPapua New GuineaParaguayPeruPhilippinesPolandPortugalPost-demographic dividendPre-demographic dividendQatarRomaniaRussian FederationRwandaSamoaSao Tome and PrincipeSaudi ArabiaSenegalSerbiaSeychellesSierra LeoneSingaporeSint Maarten (Dutch part)Slovak RepublicSloveniaSmall statesSolomon IslandsSouth AfricaSouth AsiaSouth Asia (IDA & IBRD)South SudanSpainSri LankaSt. Kitts and NevisSt. LuciaSt. Vincent and the GrenadinesSub-Saharan Africa Sub-Saharan Africa (excluding high income)Sub-Saharan Africa (IDA & IBRD countries)SudanSurinameSwazilandSwedenSwitzerlandSyrian Arab RepublicTajikistanTanzaniaThailandTimor-LesteTogoTongaTrinidad and TobagoTunisiaTurkeyTuvaluUgandaUkraineUnited KingdomUnited StatesUpper middle incomeUruguayVanuatuVenezuela, RBWest Bank and GazaWorldZambiaZimbabwe Timeline:
This timeline shows a graph from 1977 to 2016 of Tunisia. No data until 1976. Number of actual observations by date: 40.
Source name:
World Development Indicators
Source organization:
International Monetary Fund, Balance of Payments Statistics Yearbook and data files.
Categories, topics:
Private Sector, Trade
Last updated:
apr 23, 2017
Indicators value changes by year
At the date of observation
Value
Absolute change
Change from previous value
jan 1, 1977
3.107
+3.107
0.0%
jan 1, 1978
1.822
-1.284
-41.34%
jan 1, 1979
2.31
+0.488
26.78%
jan 1, 1980
2.474
+0.163
7.06%
jan 1, 1981
1.746
-0.728
-29.43%
jan 1, 1982
1.83
+0.084
4.84%
jan 1, 1983
1.718
-0.112
-6.1%
jan 1, 1984
1.6
-0.118
-6.89%
jan 1, 1985
2.09
+0.49
30.61%
jan 1, 1986
2.931
+0.841
40.24%
jan 1, 1987
2.882
-0.049
-1.67%
jan 1, 1988
2.497
-0.384
-13.34%
jan 1, 1989
1.385
-1.112
-44.53%
jan 1, 1990
1.427
+0.042
3.05%
jan 1, 1991
1.518
+0.091
6.38%
jan 1, 1992
2.564
+1.046
68.86%
jan 1, 1993
2.097
-0.467
-18.21%
jan 1, 1994
1.582
-0.515
-24.58%
jan 1, 1995
1.637
+0.055
3.51%
jan 1, 1996
1.541
-0.096
-5.86%
jan 1, 1997
1.789
+0.247
16.06%
jan 1, 1998
2.154
+0.366
20.45%
jan 1, 1999
2.069
-0.086
-3.98%
jan 1, 2000
1.877
-0.192
-9.29%
jan 1, 2001
1.872
-0.004
-0.23%
jan 1, 2002
2.192
+0.319
17.05%
jan 1, 2003
2.516
+0.325
14.81%
jan 1, 2004
2.777
+0.261
10.36%
jan 1, 2005
2.551
-0.226
-8.15%
jan 1, 2006
2.62
+0.07
2.73%
jan 1, 2007
2.626
+0.006
0.21%
jan 1, 2008
2.443
-0.183
-6.98%
jan 1, 2009
2.274
-0.168
-6.89%
jan 1, 2010
2.32
+0.045
2.0%
jan 1, 2011
2.601
+0.281
12.1%
jan 1, 2012
2.956
+0.356
13.68%
jan 1, 2013
2.851
-0.106
-3.57%
jan 1, 2014
2.979
+0.128
4.49%
jan 1, 2015
3.009
+0.03
1.01%
jan 1, 2016
3.761
+0.752
24.99%
Ranking of countries by current statistics by years


Comments: