29
/
en
AIzaSyAYiBZKx7MnpbEhh9jyipgxe19OcubqV5w
April 1, 2024
105024
Chile
CHL
true
2
1
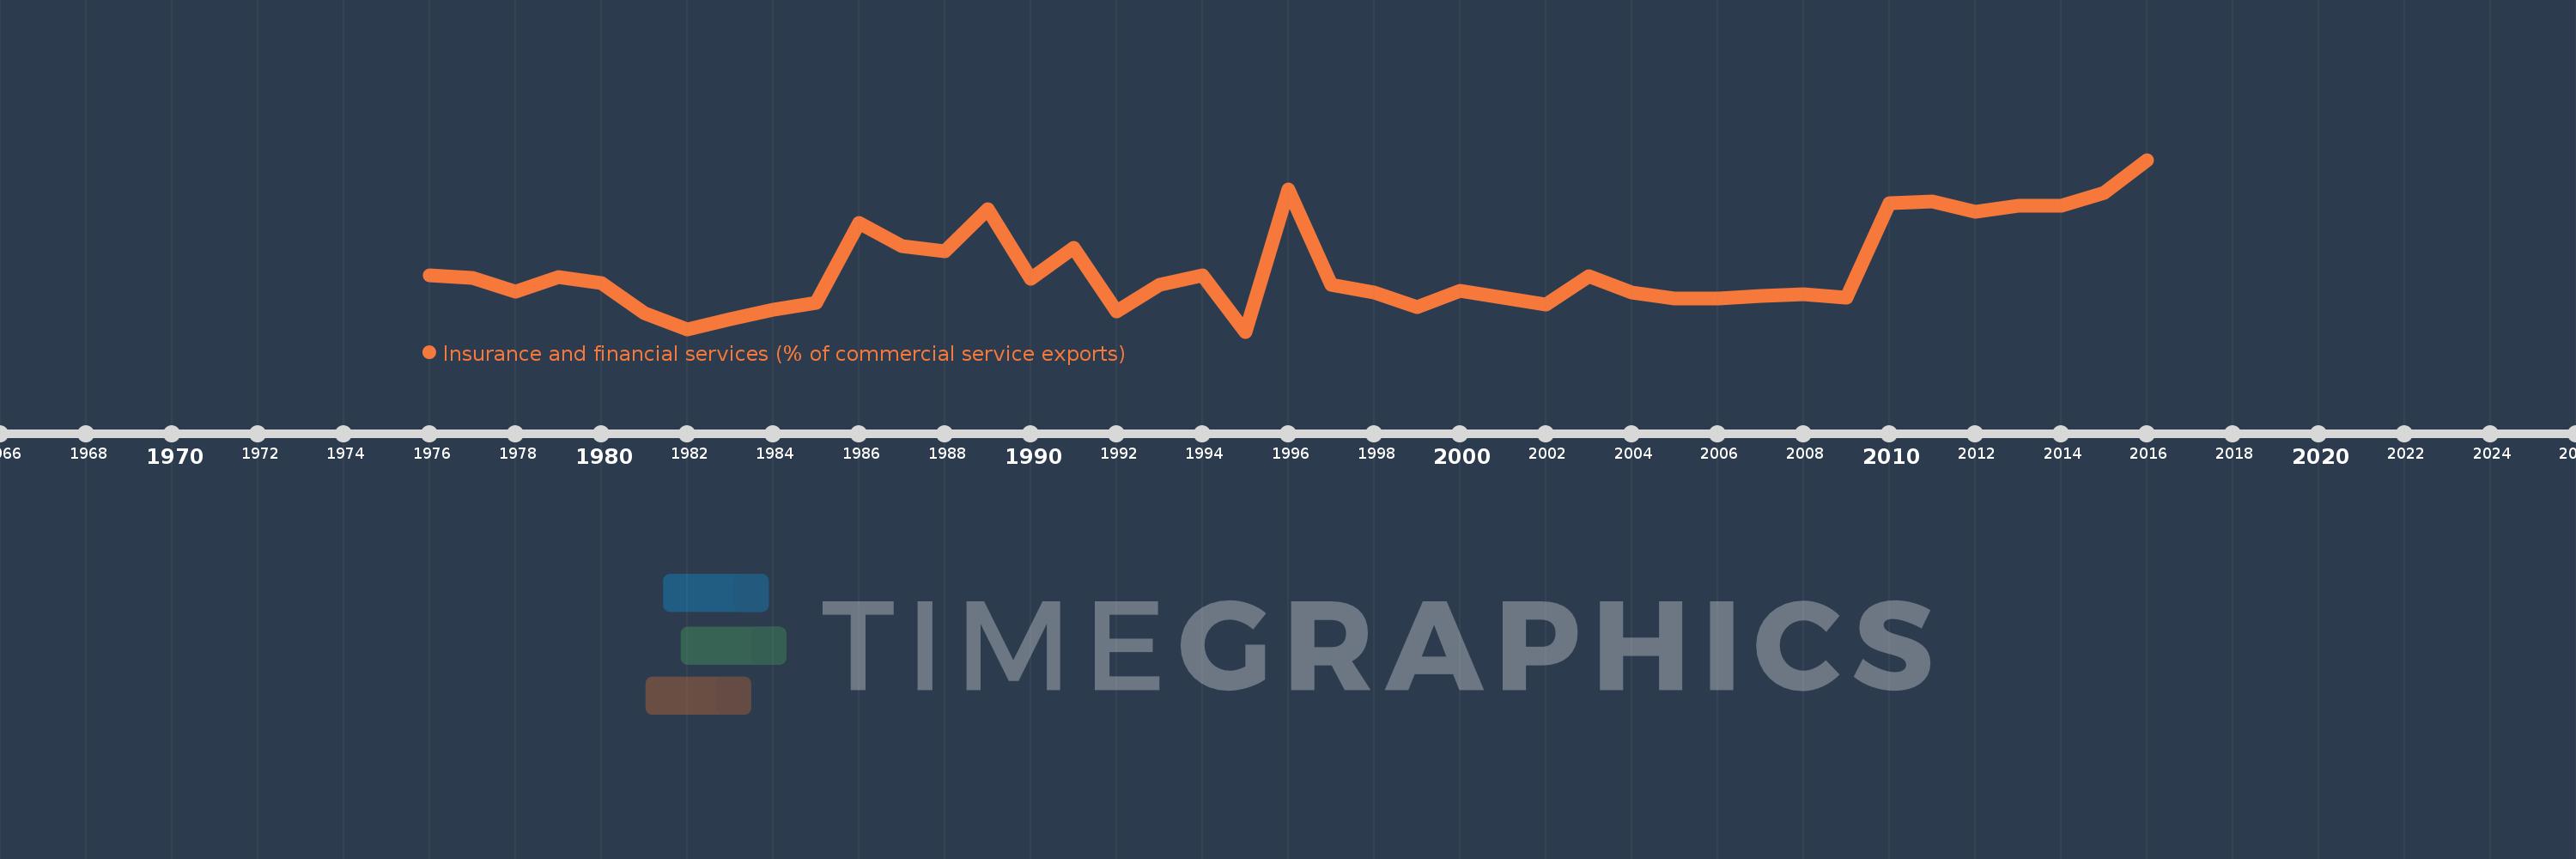
Insurance and financial services (% of commercial service exports)
2016,2015,2014,2013,2012,2011,2010,2009,2008,2007,2006,2005,2004,2003,2002,2001,2000,1999,1998,1997,1996,1995,1994,1993,1992,1991,1990,1989,1988,1987,1986,1985,1984,1983,1982,1981,1980,1979,1978,1977,1976
This statistics in other country:
AfghanistanAlbaniaAlgeriaAngolaAntigua and BarbudaArab WorldArgentinaArmeniaArubaAustraliaAustriaAzerbaijanBahrainBangladeshBarbadosBelarusBelgiumBelizeBeninBermudaBhutanBoliviaBosnia and HerzegovinaBotswanaBrazilBrunei DarussalamBulgariaBurkina FasoBurundiCabo VerdeCambodiaCameroonCanadaCaribbean small statesCentral African RepublicCentral Europe and the BalticsChadChileChinaColombiaComorosCongo, Dem. Rep.Congo, Rep.Costa RicaCote d'IvoireCroatiaCuracaoCyprusCzech RepublicDenmarkDominicaDominican RepublicEarly-demographic dividendEast Asia & PacificEast Asia & Pacific (excluding high income)East Asia & Pacific (IDA & IBRD countries)EcuadorEgypt, Arab Rep.El SalvadorEritreaEstoniaEthiopiaEuro areaEurope & Central AsiaEurope & Central Asia (excluding high income)Europe & Central Asia (IDA & IBRD countries)European UnionFaroe IslandsFijiFinlandFragile and conflict affected situationsFranceFrench PolynesiaGabonGambia, TheGeorgiaGermanyGhanaGreeceGrenadaGuatemalaGuineaGuinea-BissauGuyanaHaitiHeavily indebted poor countries (HIPC)High incomeHondurasHong Kong SAR, ChinaHungaryIBRD onlyIcelandIDA & IBRD totalIDA onlyIDA totalIndiaIndonesiaIran, Islamic Rep.IraqIrelandIsraelItalyJamaicaJapanJordanKazakhstanKenyaKiribatiKorea, Rep.KosovoKuwaitKyrgyz RepublicLao PDRLate-demographic dividendLatin America & Caribbean Latin America & Caribbean (excluding high income)Latin America & the Caribbean (IDA & IBRD countries)LatviaLeast developed countries: UN classificationLebanonLesothoLiberiaLibyaLithuaniaLow & middle incomeLow incomeLower middle incomeLuxembourgMacao SAR, ChinaMacedonia, FYRMadagascarMalawiMalaysiaMaldivesMaliMaltaMauritaniaMauritiusMexicoMiddle East & North AfricaMiddle East & North Africa (excluding high income)Middle East & North Africa (IDA & IBRD countries)Middle incomeMoldovaMongoliaMontenegroMoroccoMozambiqueMyanmarNamibiaNepalNetherlandsNew CaledoniaNew ZealandNicaraguaNigerNigeriaNorth AmericaNorwayOECD membersOmanOther small statesPacific island small statesPakistanPalauPanamaPapua New GuineaParaguayPeruPhilippinesPolandPortugalPost-demographic dividendPre-demographic dividendQatarRomaniaRussian FederationRwandaSamoaSao Tome and PrincipeSaudi ArabiaSenegalSerbiaSeychellesSierra LeoneSingaporeSint Maarten (Dutch part)Slovak RepublicSloveniaSmall statesSolomon IslandsSouth AfricaSouth AsiaSouth Asia (IDA & IBRD)South SudanSpainSri LankaSt. Kitts and NevisSt. LuciaSt. Vincent and the GrenadinesSub-Saharan Africa Sub-Saharan Africa (excluding high income)Sub-Saharan Africa (IDA & IBRD countries)SudanSurinameSwazilandSwedenSwitzerlandSyrian Arab RepublicTajikistanTanzaniaThailandTimor-LesteTogoTongaTrinidad and TobagoTunisiaTurkeyTuvaluUgandaUkraineUnited KingdomUnited StatesUpper middle incomeUruguayVanuatuVenezuela, RBWest Bank and GazaWorldZambiaZimbabwe Timeline:
This timeline shows a graph from 1976 to 2016 of Chile. No data until 1975. Number of actual observations by date: 41.
Source name:
World Development Indicators
Source organization:
International Monetary Fund, Balance of Payments Statistics Yearbook and data files.
Categories, topics:
Private Sector, Trade
Last updated:
apr 23, 2017
Indicators value changes by year
At the date of observation
Value
Absolute change
Change from previous value
jan 1, 1976
3.797
+3.797
0.0%
jan 1, 1977
3.669
-0.128
-3.38%
jan 1, 1978
3.113
-0.556
-15.14%
jan 1, 1979
3.73
+0.617
19.8%
jan 1, 1980
3.471
-0.259
-6.96%
jan 1, 1981
2.2
-1.27
-36.6%
jan 1, 1982
1.521
-0.68
-30.89%
jan 1, 1983
1.964
+0.443
29.15%
jan 1, 1984
2.341
+0.377
19.22%
jan 1, 1985
2.629
+0.288
12.29%
jan 1, 1986
5.972
+3.343
127.16%
jan 1, 1987
5.02
-0.952
-15.94%
jan 1, 1988
4.783
-0.237
-4.73%
jan 1, 1989
6.562
+1.779
37.2%
jan 1, 1990
3.656
-2.906
-44.28%
jan 1, 1991
4.922
+1.266
34.63%
jan 1, 1992
2.267
-2.656
-53.95%
jan 1, 1993
3.383
+1.116
49.25%
jan 1, 1994
3.798
+0.415
12.26%
jan 1, 1995
1.433
-2.365
-62.28%
jan 1, 1996
7.387
+5.954
415.59%
jan 1, 1997
3.373
-4.014
-54.34%
jan 1, 1998
3.082
-0.291
-8.64%
jan 1, 1999
2.456
-0.626
-20.3%
jan 1, 2000
3.143
+0.686
27.94%
jan 1, 2001
2.841
-0.301
-9.59%
jan 1, 2002
2.572
-0.27
-9.49%
jan 1, 2003
3.764
+1.192
46.37%
jan 1, 2004
3.079
-0.685
-18.2%
jan 1, 2005
2.817
-0.262
-8.5%
jan 1, 2006
2.799
-0.019
-0.66%
jan 1, 2007
2.934
+0.135
4.83%
jan 1, 2008
2.985
+0.051
1.73%
jan 1, 2009
2.846
-0.138
-4.64%
jan 1, 2010
6.795
+3.949
138.73%
jan 1, 2011
6.869
+0.074
1.08%
jan 1, 2012
6.458
-0.411
-5.98%
jan 1, 2013
6.683
+0.225
3.48%
jan 1, 2014
6.695
+0.012
0.18%
jan 1, 2015
7.228
+0.533
7.96%
jan 1, 2016
8.618
+1.389
19.22%
Ranking of countries by current statistics by years


Comments: