29
/
en
AIzaSyAYiBZKx7MnpbEhh9jyipgxe19OcubqV5w
April 1, 2024
161614
Italy
ITA
true
2
1
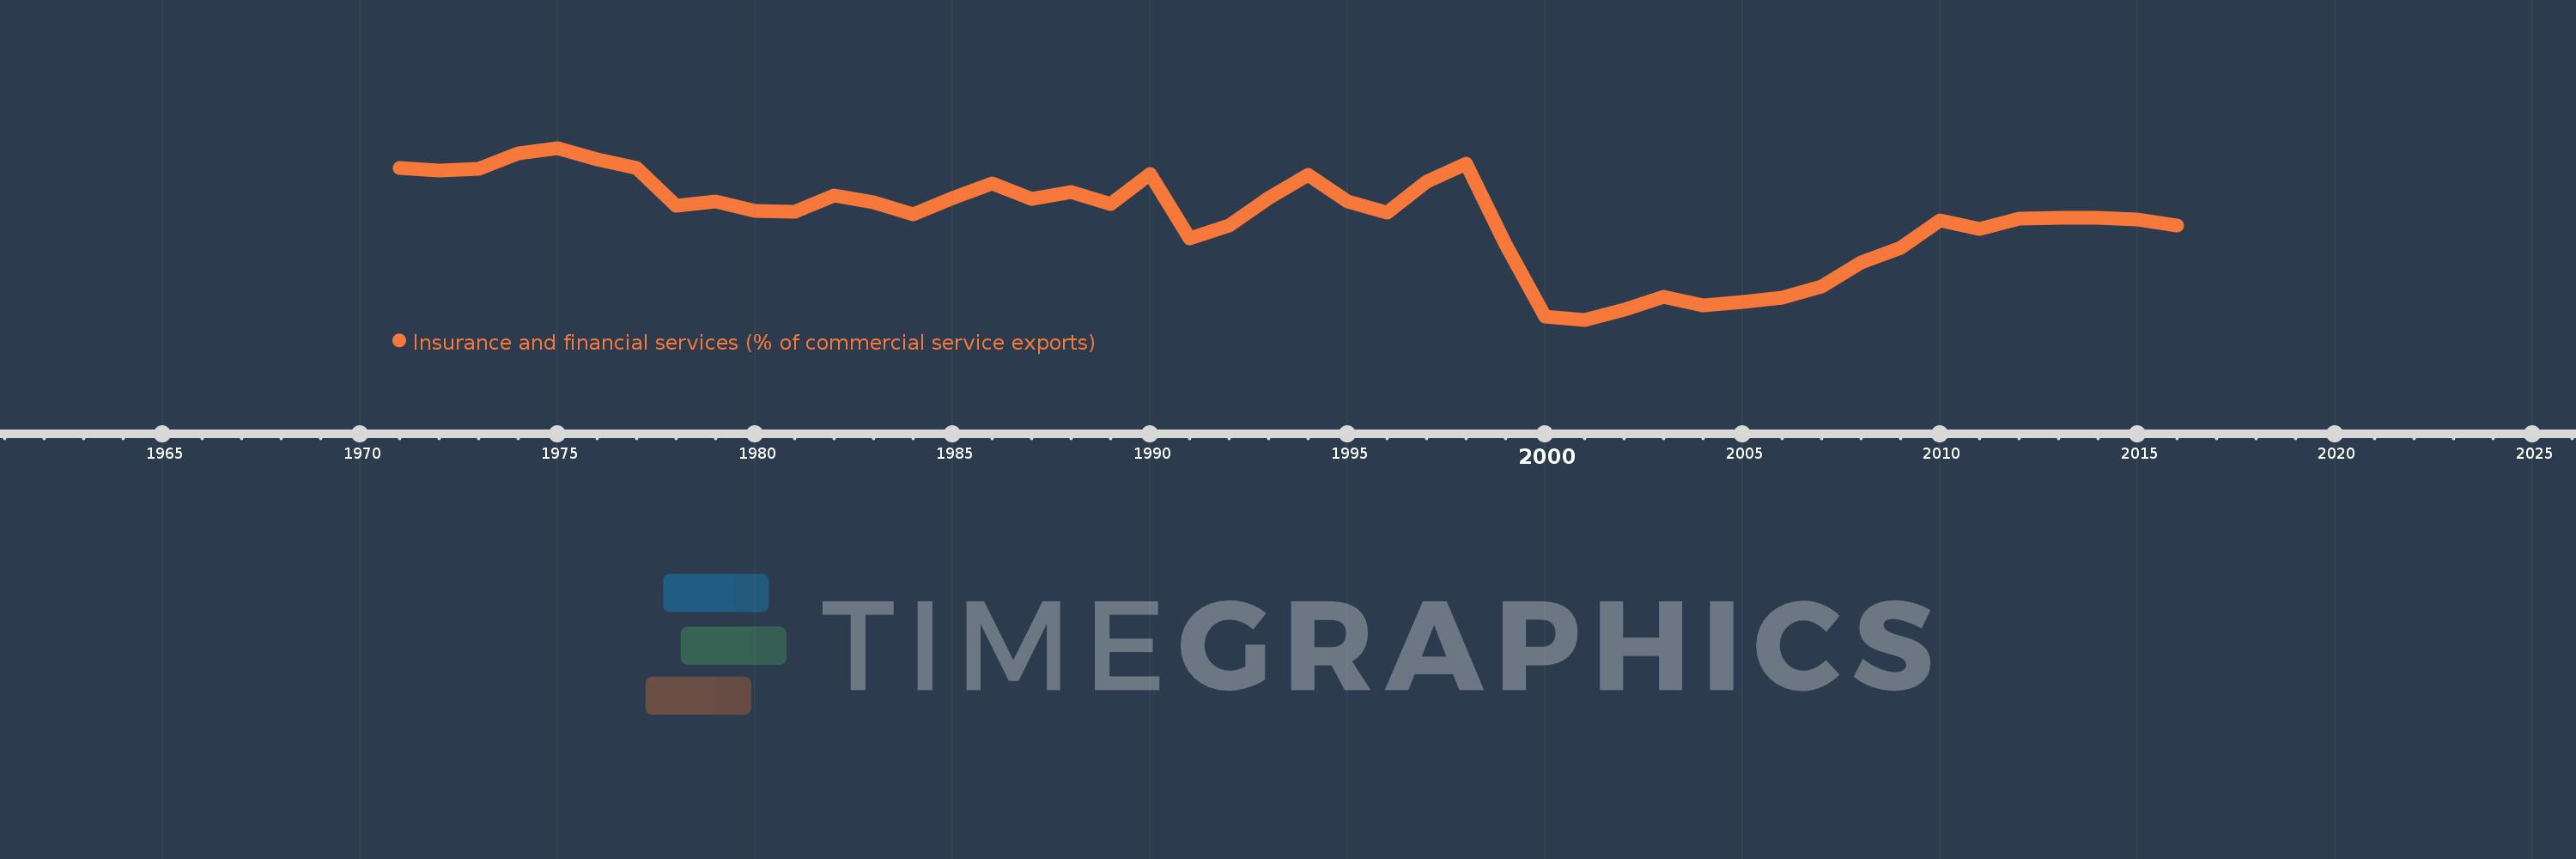
Insurance and financial services (% of commercial service exports)
2016,2015,2014,2013,2012,2011,2010,2009,2008,2007,2006,2005,2004,2003,2002,2001,2000,1999,1998,1997,1996,1995,1994,1993,1992,1991,1990,1989,1988,1987,1986,1985,1984,1983,1982,1981,1980,1979,1978,1977,1976,1975,1974,1973,1972,1971
This statistics in other country:
AfghanistanAlbaniaAlgeriaAngolaAntigua and BarbudaArab WorldArgentinaArmeniaArubaAustraliaAustriaAzerbaijanBahrainBangladeshBarbadosBelarusBelgiumBelizeBeninBermudaBhutanBoliviaBosnia and HerzegovinaBotswanaBrazilBrunei DarussalamBulgariaBurkina FasoBurundiCabo VerdeCambodiaCameroonCanadaCaribbean small statesCentral African RepublicCentral Europe and the BalticsChadChileChinaColombiaComorosCongo, Dem. Rep.Congo, Rep.Costa RicaCote d'IvoireCroatiaCuracaoCyprusCzech RepublicDenmarkDominicaDominican RepublicEarly-demographic dividendEast Asia & PacificEast Asia & Pacific (excluding high income)East Asia & Pacific (IDA & IBRD countries)EcuadorEgypt, Arab Rep.El SalvadorEritreaEstoniaEthiopiaEuro areaEurope & Central AsiaEurope & Central Asia (excluding high income)Europe & Central Asia (IDA & IBRD countries)European UnionFaroe IslandsFijiFinlandFragile and conflict affected situationsFranceFrench PolynesiaGabonGambia, TheGeorgiaGermanyGhanaGreeceGrenadaGuatemalaGuineaGuinea-BissauGuyanaHaitiHeavily indebted poor countries (HIPC)High incomeHondurasHong Kong SAR, ChinaHungaryIBRD onlyIcelandIDA & IBRD totalIDA onlyIDA totalIndiaIndonesiaIran, Islamic Rep.IraqIrelandIsraelItalyJamaicaJapanJordanKazakhstanKenyaKiribatiKorea, Rep.KosovoKuwaitKyrgyz RepublicLao PDRLate-demographic dividendLatin America & Caribbean Latin America & Caribbean (excluding high income)Latin America & the Caribbean (IDA & IBRD countries)LatviaLeast developed countries: UN classificationLebanonLesothoLiberiaLibyaLithuaniaLow & middle incomeLow incomeLower middle incomeLuxembourgMacao SAR, ChinaMacedonia, FYRMadagascarMalawiMalaysiaMaldivesMaliMaltaMauritaniaMauritiusMexicoMiddle East & North AfricaMiddle East & North Africa (excluding high income)Middle East & North Africa (IDA & IBRD countries)Middle incomeMoldovaMongoliaMontenegroMoroccoMozambiqueMyanmarNamibiaNepalNetherlandsNew CaledoniaNew ZealandNicaraguaNigerNigeriaNorth AmericaNorwayOECD membersOmanOther small statesPacific island small statesPakistanPalauPanamaPapua New GuineaParaguayPeruPhilippinesPolandPortugalPost-demographic dividendPre-demographic dividendQatarRomaniaRussian FederationRwandaSamoaSao Tome and PrincipeSaudi ArabiaSenegalSerbiaSeychellesSierra LeoneSingaporeSint Maarten (Dutch part)Slovak RepublicSloveniaSmall statesSolomon IslandsSouth AfricaSouth AsiaSouth Asia (IDA & IBRD)South SudanSpainSri LankaSt. Kitts and NevisSt. LuciaSt. Vincent and the GrenadinesSub-Saharan Africa Sub-Saharan Africa (excluding high income)Sub-Saharan Africa (IDA & IBRD countries)SudanSurinameSwazilandSwedenSwitzerlandSyrian Arab RepublicTajikistanTanzaniaThailandTimor-LesteTogoTongaTrinidad and TobagoTunisiaTurkeyTuvaluUgandaUkraineUnited KingdomUnited StatesUpper middle incomeUruguayVanuatuVenezuela, RBWest Bank and GazaWorldZambiaZimbabwe Timeline:
This timeline shows a graph from 1971 to 2016 of Italy. No data until 1970. Number of actual observations by date: 46.
Source name:
World Development Indicators
Source organization:
International Monetary Fund, Balance of Payments Statistics Yearbook and data files.
Categories, topics:
Private Sector, Trade
Last updated:
apr 23, 2017
Indicators value changes by year
Maximum:
10.077
jan 1, 1975
At the date of observation
Value
Absolute change
Change from previous value
jan 1, 1971
9.165
+9.165
0.0%
jan 1, 1972
9.033
-0.132
-1.44%
jan 1, 1973
9.133
+0.1
1.11%
jan 1, 1974
9.818
+0.685
7.5%
jan 1, 1975
10.077
+0.259
2.63%
jan 1, 1976
9.546
-0.531
-5.27%
jan 1, 1977
9.168
-0.378
-3.96%
jan 1, 1978
7.427
-1.741
-18.99%
jan 1, 1979
7.647
+0.22
2.97%
jan 1, 1980
7.19
-0.457
-5.97%
jan 1, 1981
7.143
-0.048
-0.66%
jan 1, 1982
7.9
+0.757
10.6%
jan 1, 1983
7.575
-0.325
-4.11%
jan 1, 1984
7.037
-0.538
-7.1%
jan 1, 1985
7.795
+0.758
10.77%
jan 1, 1986
8.441
+0.646
8.29%
jan 1, 1987
7.753
-0.688
-8.15%
jan 1, 1988
8.076
+0.322
4.16%
jan 1, 1989
7.514
-0.562
-6.96%
jan 1, 1990
8.891
+1.378
18.34%
jan 1, 1991
5.956
-2.935
-33.01%
jan 1, 1992
6.528
+0.571
9.59%
jan 1, 1993
7.791
+1.264
19.36%
jan 1, 1994
8.854
+1.063
13.64%
jan 1, 1995
7.651
-1.202
-13.58%
jan 1, 1996
7.112
-0.539
-7.05%
jan 1, 1997
8.535
+1.423
20.0%
jan 1, 1998
9.372
+0.838
9.82%
jan 1, 1999
5.662
-3.711
-39.59%
jan 1, 2000
2.359
-3.303
-58.33%
jan 1, 2001
2.226
-0.134
-5.67%
jan 1, 2002
2.702
+0.476
21.4%
jan 1, 2003
3.288
+0.586
21.68%
jan 1, 2004
2.89
-0.398
-12.1%
jan 1, 2005
3.05
+0.16
5.52%
jan 1, 2006
3.237
+0.188
6.15%
jan 1, 2007
3.756
+0.518
16.01%
jan 1, 2008
4.86
+1.104
29.4%
jan 1, 2009
5.503
+0.643
13.23%
jan 1, 2010
6.773
+1.27
23.07%
jan 1, 2011
6.389
-0.384
-5.66%
jan 1, 2012
6.864
+0.475
7.43%
jan 1, 2013
6.869
+0.006
0.08%
jan 1, 2014
6.871
+0.002
0.03%
jan 1, 2015
6.816
-0.055
-0.8%
jan 1, 2016
6.531
-0.286
-4.19%
Ranking of countries by current statistics by years


Comments: