29
/
en
AIzaSyAYiBZKx7MnpbEhh9jyipgxe19OcubqV5w
April 1, 2024
29964
Euro area
EMU
false
2
1
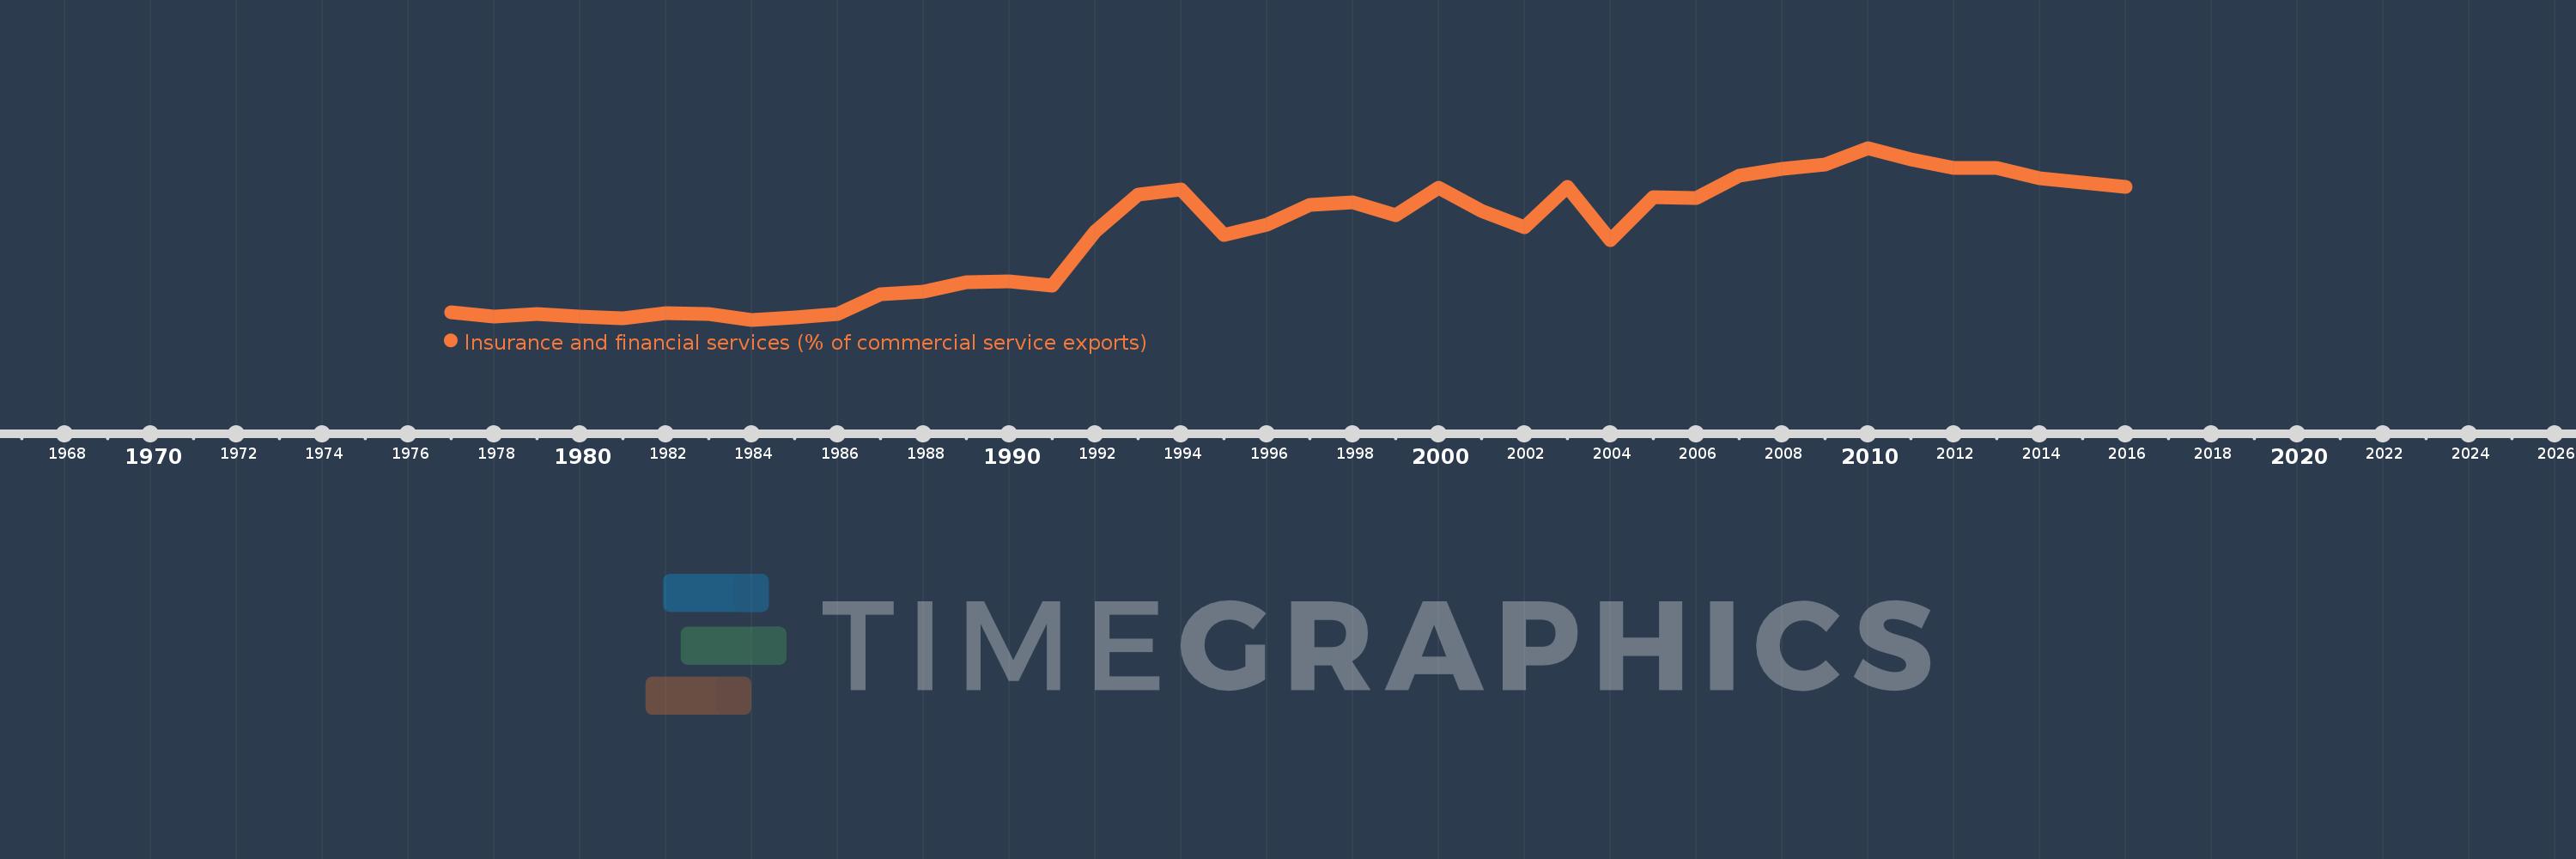
Insurance and financial services (% of commercial service exports)
2016,2015,2014,2013,2012,2011,2010,2009,2008,2007,2006,2005,2004,2003,2002,2001,2000,1999,1998,1997,1996,1995,1994,1993,1992,1991,1990,1989,1988,1987,1986,1985,1984,1983,1982,1981,1980,1979,1978,1977
This statistics in other country:
AfghanistanAlbaniaAlgeriaAngolaAntigua and BarbudaArab WorldArgentinaArmeniaArubaAustraliaAustriaAzerbaijanBahrainBangladeshBarbadosBelarusBelgiumBelizeBeninBermudaBhutanBoliviaBosnia and HerzegovinaBotswanaBrazilBrunei DarussalamBulgariaBurkina FasoBurundiCabo VerdeCambodiaCameroonCanadaCaribbean small statesCentral African RepublicCentral Europe and the BalticsChadChileChinaColombiaComorosCongo, Dem. Rep.Congo, Rep.Costa RicaCote d'IvoireCroatiaCuracaoCyprusCzech RepublicDenmarkDominicaDominican RepublicEarly-demographic dividendEast Asia & PacificEast Asia & Pacific (excluding high income)East Asia & Pacific (IDA & IBRD countries)EcuadorEgypt, Arab Rep.El SalvadorEritreaEstoniaEthiopiaEuro areaEurope & Central AsiaEurope & Central Asia (excluding high income)Europe & Central Asia (IDA & IBRD countries)European UnionFaroe IslandsFijiFinlandFragile and conflict affected situationsFranceFrench PolynesiaGabonGambia, TheGeorgiaGermanyGhanaGreeceGrenadaGuatemalaGuineaGuinea-BissauGuyanaHaitiHeavily indebted poor countries (HIPC)High incomeHondurasHong Kong SAR, ChinaHungaryIBRD onlyIcelandIDA & IBRD totalIDA onlyIDA totalIndiaIndonesiaIran, Islamic Rep.IraqIrelandIsraelItalyJamaicaJapanJordanKazakhstanKenyaKiribatiKorea, Rep.KosovoKuwaitKyrgyz RepublicLao PDRLate-demographic dividendLatin America & Caribbean Latin America & Caribbean (excluding high income)Latin America & the Caribbean (IDA & IBRD countries)LatviaLeast developed countries: UN classificationLebanonLesothoLiberiaLibyaLithuaniaLow & middle incomeLow incomeLower middle incomeLuxembourgMacao SAR, ChinaMacedonia, FYRMadagascarMalawiMalaysiaMaldivesMaliMaltaMauritaniaMauritiusMexicoMiddle East & North AfricaMiddle East & North Africa (excluding high income)Middle East & North Africa (IDA & IBRD countries)Middle incomeMoldovaMongoliaMontenegroMoroccoMozambiqueMyanmarNamibiaNepalNetherlandsNew CaledoniaNew ZealandNicaraguaNigerNigeriaNorth AmericaNorwayOECD membersOmanOther small statesPacific island small statesPakistanPalauPanamaPapua New GuineaParaguayPeruPhilippinesPolandPortugalPost-demographic dividendPre-demographic dividendQatarRomaniaRussian FederationRwandaSamoaSao Tome and PrincipeSaudi ArabiaSenegalSerbiaSeychellesSierra LeoneSingaporeSint Maarten (Dutch part)Slovak RepublicSloveniaSmall statesSolomon IslandsSouth AfricaSouth AsiaSouth Asia (IDA & IBRD)South SudanSpainSri LankaSt. Kitts and NevisSt. LuciaSt. Vincent and the GrenadinesSub-Saharan Africa Sub-Saharan Africa (excluding high income)Sub-Saharan Africa (IDA & IBRD countries)SudanSurinameSwazilandSwedenSwitzerlandSyrian Arab RepublicTajikistanTanzaniaThailandTimor-LesteTogoTongaTrinidad and TobagoTunisiaTurkeyTuvaluUgandaUkraineUnited KingdomUnited StatesUpper middle incomeUruguayVanuatuVenezuela, RBWest Bank and GazaWorldZambiaZimbabwe Timeline:
This timeline shows a graph from 1977 to 2016 of Euro area. No data until 1976. Number of actual observations by date: 40.
Source name:
World Development Indicators
Source organization:
International Monetary Fund, Balance of Payments Statistics Yearbook and data files.
Categories, topics:
Private Sector, Trade
Last updated:
apr 23, 2017
Indicators value changes by year
At the date of observation
Value
Absolute change
Change from previous value
jan 1, 1977
2.844
+2.844
0.0%
jan 1, 1978
2.658
-0.185
-6.52%
jan 1, 1979
2.755
+0.097
3.65%
jan 1, 1980
2.648
-0.108
-3.91%
jan 1, 1981
2.575
-0.072
-2.72%
jan 1, 1982
2.804
+0.229
8.88%
jan 1, 1983
2.755
-0.049
-1.74%
jan 1, 1984
2.502
-0.254
-9.2%
jan 1, 1985
2.627
+0.126
5.02%
jan 1, 1986
2.756
+0.129
4.91%
jan 1, 1987
3.697
+0.94
34.12%
jan 1, 1988
3.819
+0.122
3.31%
jan 1, 1989
4.279
+0.46
12.04%
jan 1, 1990
4.315
+0.036
0.84%
jan 1, 1991
4.105
-0.209
-4.85%
jan 1, 1992
6.669
+2.564
62.44%
jan 1, 1993
8.436
+1.767
26.5%
jan 1, 1994
8.649
+0.213
2.52%
jan 1, 1995
6.498
-2.151
-24.87%
jan 1, 1996
7.008
+0.51
7.85%
jan 1, 1997
7.93
+0.922
13.15%
jan 1, 1998
8.032
+0.102
1.28%
jan 1, 1999
7.43
-0.602
-7.49%
jan 1, 2000
8.734
+1.304
17.55%
jan 1, 2001
7.628
-1.105
-12.66%
jan 1, 2002
6.887
-0.741
-9.72%
jan 1, 2003
8.785
+1.898
27.56%
jan 1, 2004
6.258
-2.527
-28.77%
jan 1, 2005
8.31
+2.052
32.78%
jan 1, 2006
8.247
-0.063
-0.75%
jan 1, 2007
9.323
+1.076
13.04%
jan 1, 2008
9.621
+0.298
3.2%
jan 1, 2009
9.825
+0.205
2.13%
jan 1, 2010
10.62
+0.795
8.09%
jan 1, 2011
10.073
-0.547
-5.15%
jan 1, 2012
9.675
-0.397
-3.94%
jan 1, 2013
9.694
+0.019
0.19%
jan 1, 2014
9.203
-0.491
-5.06%
jan 1, 2015
8.977
-0.226
-2.46%
jan 1, 2016
8.798
-0.18
-2.0%
Ranking of countries by current statistics by years


Comments: