29
/
en
AIzaSyAYiBZKx7MnpbEhh9jyipgxe19OcubqV5w
April 1, 2024
52713
OECD members
OED
false
2
1
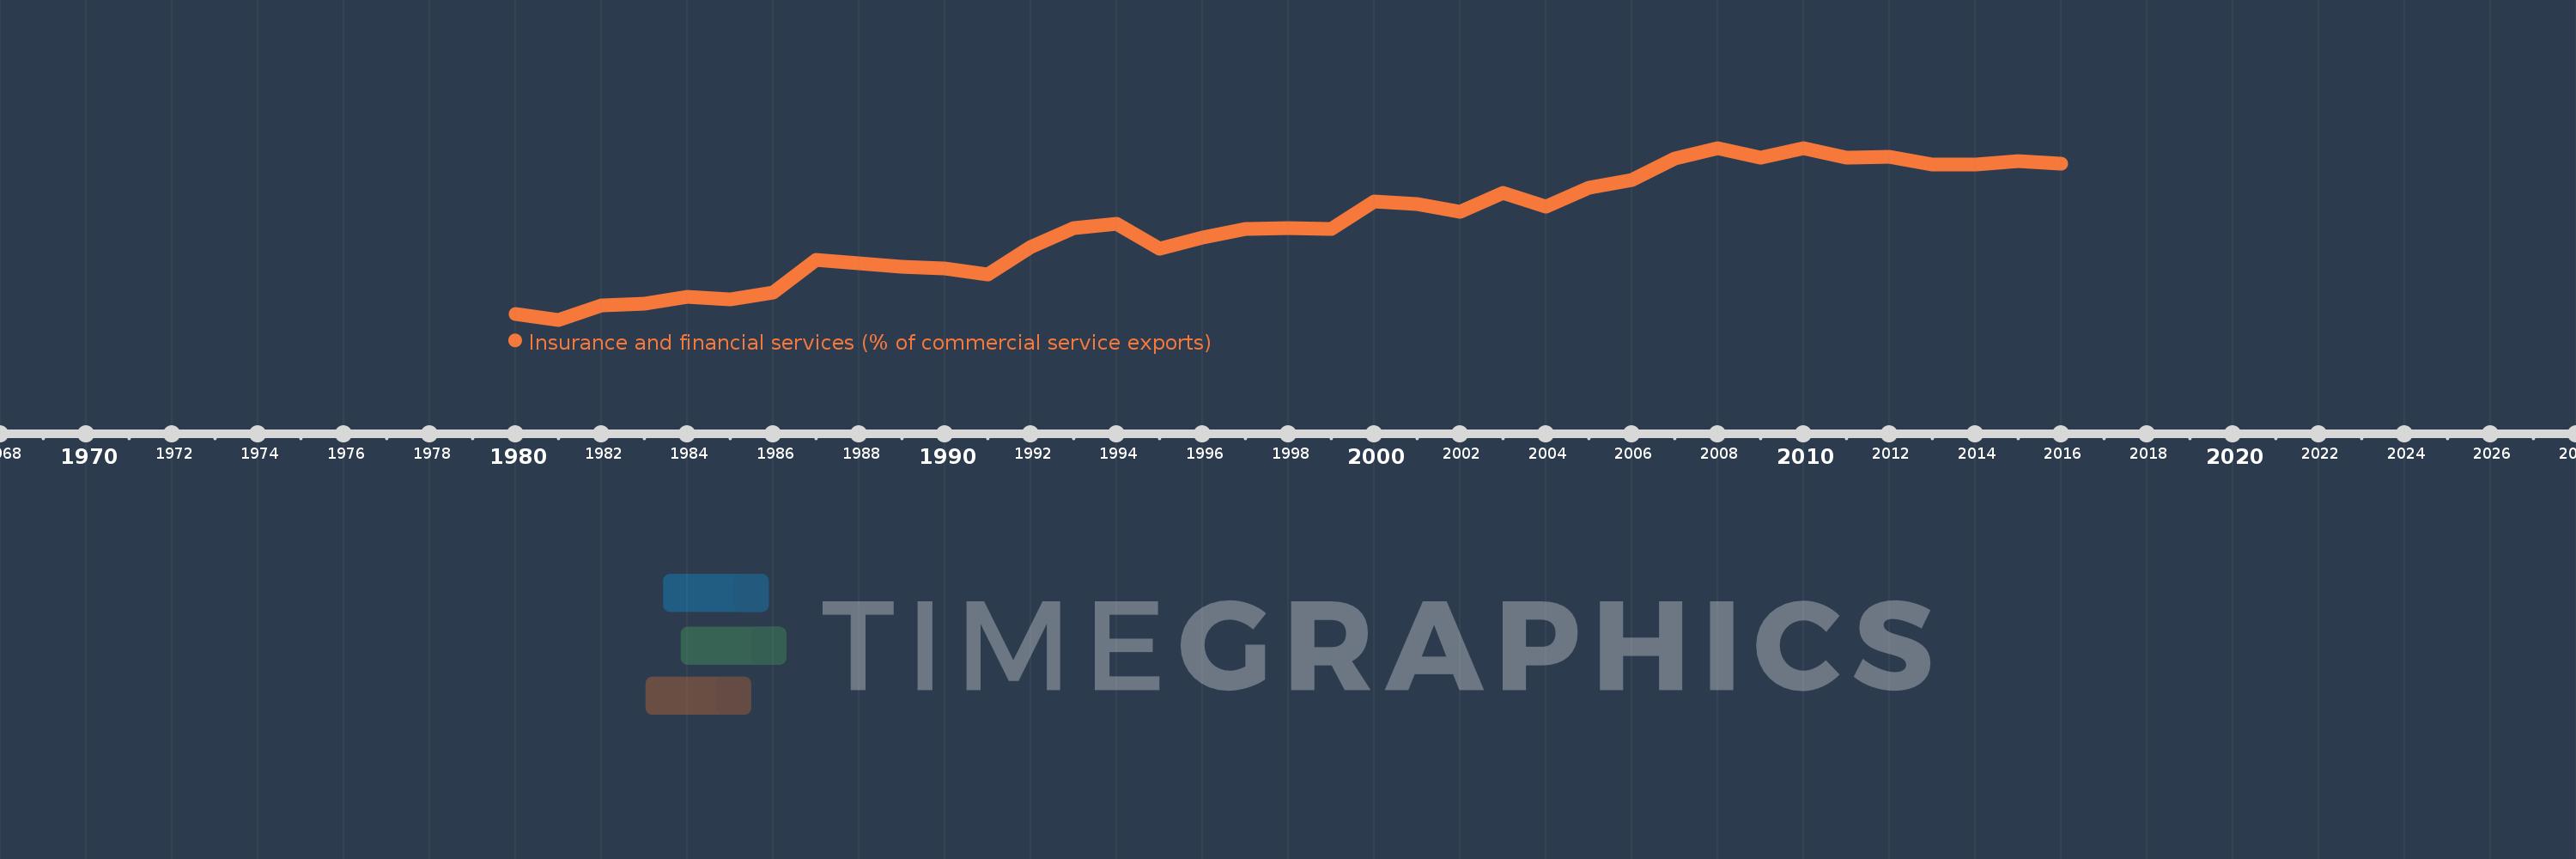
Insurance and financial services (% of commercial service exports)
2016,2015,2014,2013,2012,2011,2010,2009,2008,2007,2006,2005,2004,2003,2002,2001,2000,1999,1998,1997,1996,1995,1994,1993,1992,1991,1990,1989,1988,1987,1986,1985,1984,1983,1982,1981,1980
This statistics in other country:
AfghanistanAlbaniaAlgeriaAngolaAntigua and BarbudaArab WorldArgentinaArmeniaArubaAustraliaAustriaAzerbaijanBahrainBangladeshBarbadosBelarusBelgiumBelizeBeninBermudaBhutanBoliviaBosnia and HerzegovinaBotswanaBrazilBrunei DarussalamBulgariaBurkina FasoBurundiCabo VerdeCambodiaCameroonCanadaCaribbean small statesCentral African RepublicCentral Europe and the BalticsChadChileChinaColombiaComorosCongo, Dem. Rep.Congo, Rep.Costa RicaCote d'IvoireCroatiaCuracaoCyprusCzech RepublicDenmarkDominicaDominican RepublicEarly-demographic dividendEast Asia & PacificEast Asia & Pacific (excluding high income)East Asia & Pacific (IDA & IBRD countries)EcuadorEgypt, Arab Rep.El SalvadorEritreaEstoniaEthiopiaEuro areaEurope & Central AsiaEurope & Central Asia (excluding high income)Europe & Central Asia (IDA & IBRD countries)European UnionFaroe IslandsFijiFinlandFragile and conflict affected situationsFranceFrench PolynesiaGabonGambia, TheGeorgiaGermanyGhanaGreeceGrenadaGuatemalaGuineaGuinea-BissauGuyanaHaitiHeavily indebted poor countries (HIPC)High incomeHondurasHong Kong SAR, ChinaHungaryIBRD onlyIcelandIDA & IBRD totalIDA onlyIDA totalIndiaIndonesiaIran, Islamic Rep.IraqIrelandIsraelItalyJamaicaJapanJordanKazakhstanKenyaKiribatiKorea, Rep.KosovoKuwaitKyrgyz RepublicLao PDRLate-demographic dividendLatin America & Caribbean Latin America & Caribbean (excluding high income)Latin America & the Caribbean (IDA & IBRD countries)LatviaLeast developed countries: UN classificationLebanonLesothoLiberiaLibyaLithuaniaLow & middle incomeLow incomeLower middle incomeLuxembourgMacao SAR, ChinaMacedonia, FYRMadagascarMalawiMalaysiaMaldivesMaliMaltaMauritaniaMauritiusMexicoMiddle East & North AfricaMiddle East & North Africa (excluding high income)Middle East & North Africa (IDA & IBRD countries)Middle incomeMoldovaMongoliaMontenegroMoroccoMozambiqueMyanmarNamibiaNepalNetherlandsNew CaledoniaNew ZealandNicaraguaNigerNigeriaNorth AmericaNorwayOECD membersOmanOther small statesPacific island small statesPakistanPalauPanamaPapua New GuineaParaguayPeruPhilippinesPolandPortugalPost-demographic dividendPre-demographic dividendQatarRomaniaRussian FederationRwandaSamoaSao Tome and PrincipeSaudi ArabiaSenegalSerbiaSeychellesSierra LeoneSingaporeSint Maarten (Dutch part)Slovak RepublicSloveniaSmall statesSolomon IslandsSouth AfricaSouth AsiaSouth Asia (IDA & IBRD)South SudanSpainSri LankaSt. Kitts and NevisSt. LuciaSt. Vincent and the GrenadinesSub-Saharan Africa Sub-Saharan Africa (excluding high income)Sub-Saharan Africa (IDA & IBRD countries)SudanSurinameSwazilandSwedenSwitzerlandSyrian Arab RepublicTajikistanTanzaniaThailandTimor-LesteTogoTongaTrinidad and TobagoTunisiaTurkeyTuvaluUgandaUkraineUnited KingdomUnited StatesUpper middle incomeUruguayVanuatuVenezuela, RBWest Bank and GazaWorldZambiaZimbabwe Timeline:
This timeline shows a graph from 1980 to 2016 of OECD members. No data until 1979. Number of actual observations by date: 37.
Source name:
World Development Indicators
Source organization:
International Monetary Fund, Balance of Payments Statistics Yearbook and data files.
Categories, topics:
Private Sector, Trade
Last updated:
apr 23, 2017
Indicators value changes by year
Maximum:
11.099
jan 1, 2008
At the date of observation
Value
Absolute change
Change from previous value
jan 1, 1980
3.389
+3.389
0.0%
jan 1, 1981
3.124
-0.265
-7.83%
jan 1, 1982
3.791
+0.668
21.37%
jan 1, 1983
3.883
+0.092
2.42%
jan 1, 1984
4.204
+0.321
8.26%
jan 1, 1985
4.074
-0.13
-3.1%
jan 1, 1986
4.4
+0.326
8.01%
jan 1, 1987
5.918
+1.518
34.5%
jan 1, 1988
5.75
-0.168
-2.84%
jan 1, 1989
5.587
-0.163
-2.83%
jan 1, 1990
5.495
-0.092
-1.65%
jan 1, 1991
5.214
-0.281
-5.12%
jan 1, 1992
6.507
+1.293
24.81%
jan 1, 1993
7.398
+0.891
13.7%
jan 1, 1994
7.59
+0.192
2.59%
jan 1, 1995
6.416
-1.174
-15.47%
jan 1, 1996
6.922
+0.506
7.89%
jan 1, 1997
7.331
+0.409
5.91%
jan 1, 1998
7.371
+0.039
0.54%
jan 1, 1999
7.331
-0.04
-0.54%
jan 1, 2000
8.618
+1.287
17.56%
jan 1, 2001
8.478
-0.14
-1.62%
jan 1, 2002
8.127
-0.351
-4.14%
jan 1, 2003
9.007
+0.88
10.82%
jan 1, 2004
8.382
-0.625
-6.94%
jan 1, 2005
9.266
+0.884
10.54%
jan 1, 2006
9.598
+0.332
3.59%
jan 1, 2007
10.606
+1.008
10.5%
jan 1, 2008
11.099
+0.493
4.65%
jan 1, 2009
10.647
-0.452
-4.07%
jan 1, 2010
11.084
+0.437
4.11%
jan 1, 2011
10.656
-0.429
-3.87%
jan 1, 2012
10.698
+0.042
0.39%
jan 1, 2013
10.339
-0.359
-3.36%
jan 1, 2014
10.334
-0.004
-0.04%
jan 1, 2015
10.481
+0.147
1.42%
jan 1, 2016
10.354
-0.128
-1.22%
Ranking of countries by current statistics by years


Comments: