29
/
en
AIzaSyAYiBZKx7MnpbEhh9jyipgxe19OcubqV5w
April 1, 2024
57164
South Asia
SAS
false
2
1
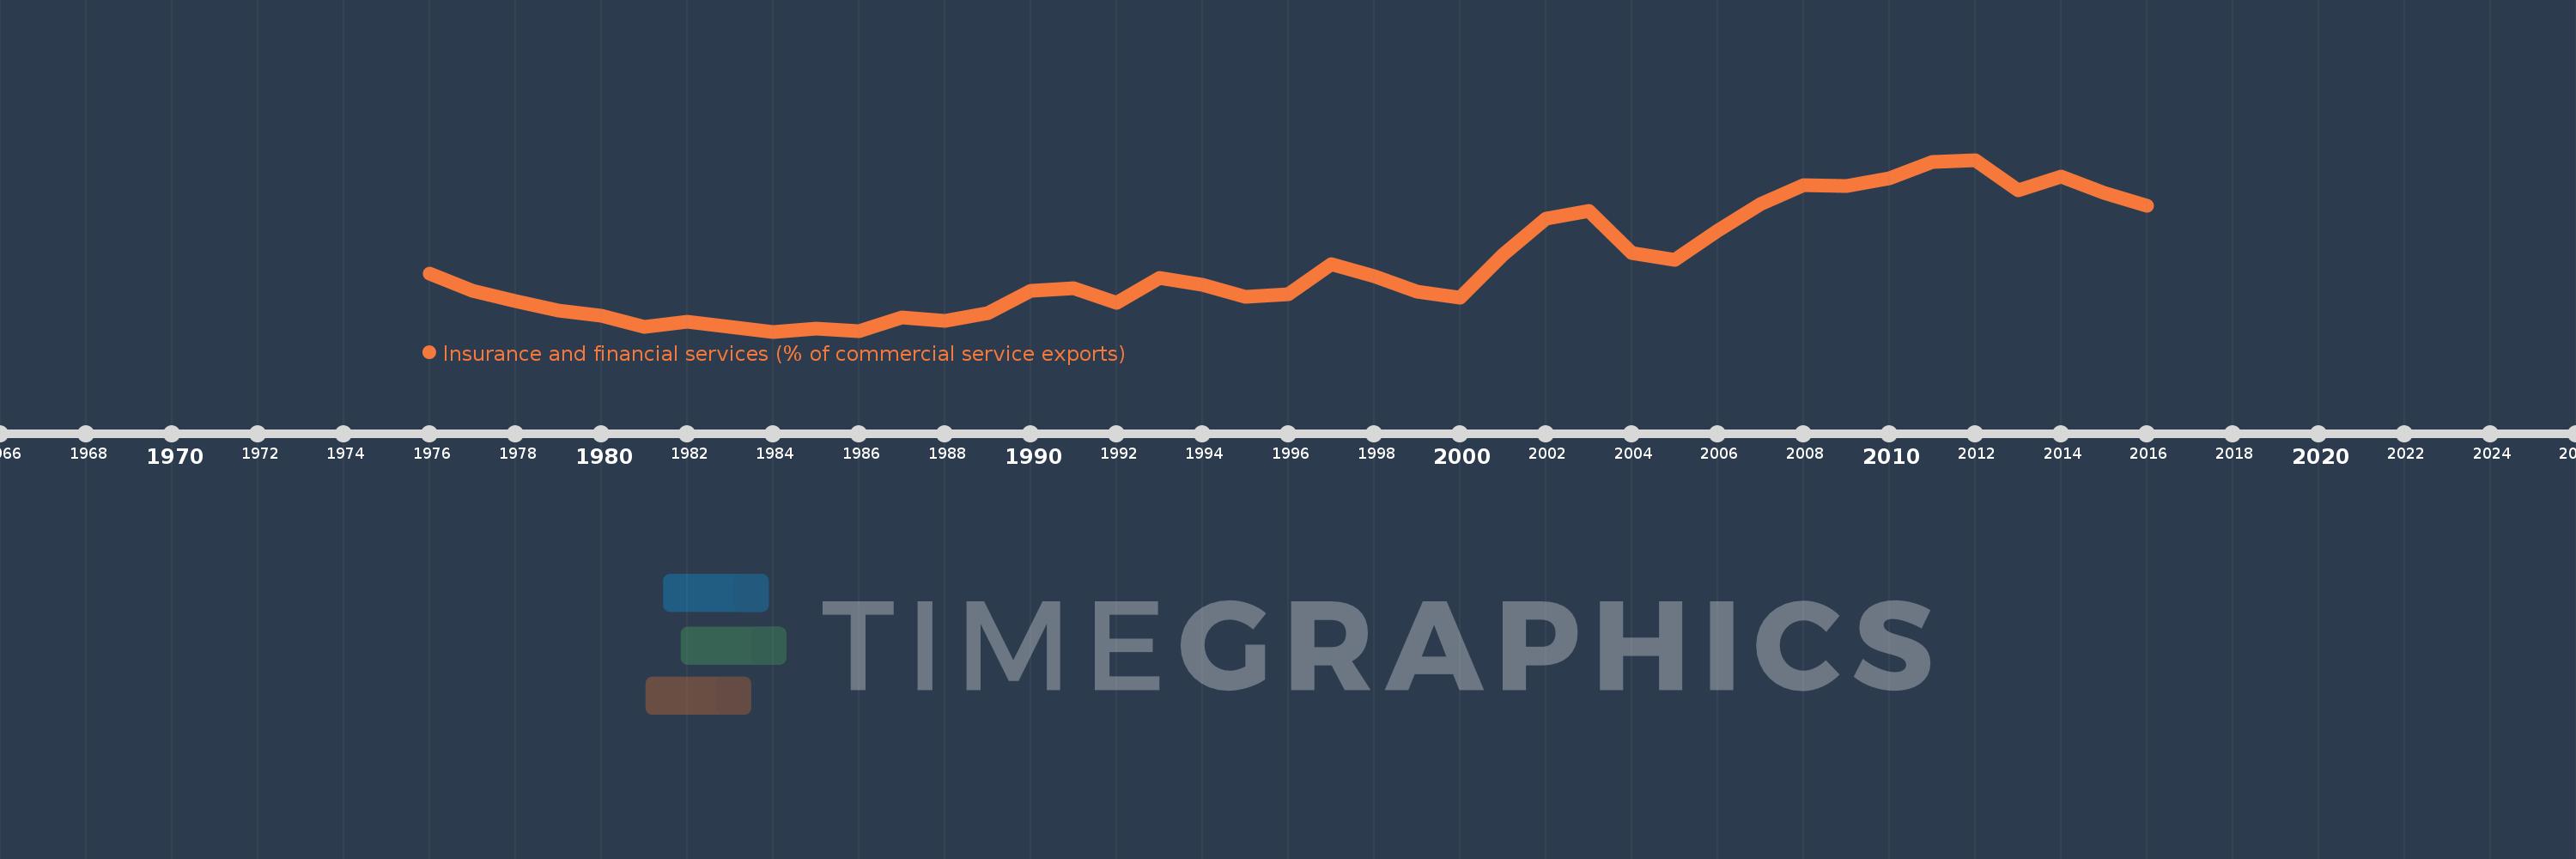
Insurance and financial services (% of commercial service exports)
2016,2015,2014,2013,2012,2011,2010,2009,2008,2007,2006,2005,2004,2003,2002,2001,2000,1999,1998,1997,1996,1995,1994,1993,1992,1991,1990,1989,1988,1987,1986,1985,1984,1983,1982,1981,1980,1979,1978,1977,1976
This statistics in other country:
AfghanistanAlbaniaAlgeriaAngolaAntigua and BarbudaArab WorldArgentinaArmeniaArubaAustraliaAustriaAzerbaijanBahrainBangladeshBarbadosBelarusBelgiumBelizeBeninBermudaBhutanBoliviaBosnia and HerzegovinaBotswanaBrazilBrunei DarussalamBulgariaBurkina FasoBurundiCabo VerdeCambodiaCameroonCanadaCaribbean small statesCentral African RepublicCentral Europe and the BalticsChadChileChinaColombiaComorosCongo, Dem. Rep.Congo, Rep.Costa RicaCote d'IvoireCroatiaCuracaoCyprusCzech RepublicDenmarkDominicaDominican RepublicEarly-demographic dividendEast Asia & PacificEast Asia & Pacific (excluding high income)East Asia & Pacific (IDA & IBRD countries)EcuadorEgypt, Arab Rep.El SalvadorEritreaEstoniaEthiopiaEuro areaEurope & Central AsiaEurope & Central Asia (excluding high income)Europe & Central Asia (IDA & IBRD countries)European UnionFaroe IslandsFijiFinlandFragile and conflict affected situationsFranceFrench PolynesiaGabonGambia, TheGeorgiaGermanyGhanaGreeceGrenadaGuatemalaGuineaGuinea-BissauGuyanaHaitiHeavily indebted poor countries (HIPC)High incomeHondurasHong Kong SAR, ChinaHungaryIBRD onlyIcelandIDA & IBRD totalIDA onlyIDA totalIndiaIndonesiaIran, Islamic Rep.IraqIrelandIsraelItalyJamaicaJapanJordanKazakhstanKenyaKiribatiKorea, Rep.KosovoKuwaitKyrgyz RepublicLao PDRLate-demographic dividendLatin America & Caribbean Latin America & Caribbean (excluding high income)Latin America & the Caribbean (IDA & IBRD countries)LatviaLeast developed countries: UN classificationLebanonLesothoLiberiaLibyaLithuaniaLow & middle incomeLow incomeLower middle incomeLuxembourgMacao SAR, ChinaMacedonia, FYRMadagascarMalawiMalaysiaMaldivesMaliMaltaMauritaniaMauritiusMexicoMiddle East & North AfricaMiddle East & North Africa (excluding high income)Middle East & North Africa (IDA & IBRD countries)Middle incomeMoldovaMongoliaMontenegroMoroccoMozambiqueMyanmarNamibiaNepalNetherlandsNew CaledoniaNew ZealandNicaraguaNigerNigeriaNorth AmericaNorwayOECD membersOmanOther small statesPacific island small statesPakistanPalauPanamaPapua New GuineaParaguayPeruPhilippinesPolandPortugalPost-demographic dividendPre-demographic dividendQatarRomaniaRussian FederationRwandaSamoaSao Tome and PrincipeSaudi ArabiaSenegalSerbiaSeychellesSierra LeoneSingaporeSint Maarten (Dutch part)Slovak RepublicSloveniaSmall statesSolomon IslandsSouth AfricaSouth AsiaSouth Asia (IDA & IBRD)South SudanSpainSri LankaSt. Kitts and NevisSt. LuciaSt. Vincent and the GrenadinesSub-Saharan Africa Sub-Saharan Africa (excluding high income)Sub-Saharan Africa (IDA & IBRD countries)SudanSurinameSwazilandSwedenSwitzerlandSyrian Arab RepublicTajikistanTanzaniaThailandTimor-LesteTogoTongaTrinidad and TobagoTunisiaTurkeyTuvaluUgandaUkraineUnited KingdomUnited StatesUpper middle incomeUruguayVanuatuVenezuela, RBWest Bank and GazaWorldZambiaZimbabwe Timeline:
This timeline shows a graph from 1976 to 2016 of South Asia. No data until 1975. Number of actual observations by date: 41.
Source name:
World Development Indicators
Source organization:
International Monetary Fund, Balance of Payments Statistics Yearbook and data files.
Categories, topics:
Private Sector, Trade
Last updated:
apr 23, 2017
Indicators value changes by year
At the date of observation
Value
Absolute change
Change from previous value
jan 1, 1976
2.845
+2.845
0.0%
jan 1, 1977
2.363
-0.482
-16.93%
jan 1, 1978
2.07
-0.293
-12.39%
jan 1, 1979
1.816
-0.254
-12.28%
jan 1, 1980
1.667
-0.148
-8.17%
jan 1, 1981
1.351
-0.317
-19.01%
jan 1, 1982
1.483
+0.133
9.83%
jan 1, 1983
1.338
-0.145
-9.77%
jan 1, 1984
1.218
-0.12
-8.98%
jan 1, 1985
1.303
+0.085
6.95%
jan 1, 1986
1.232
-0.071
-5.46%
jan 1, 1987
1.618
+0.387
31.38%
jan 1, 1988
1.526
-0.092
-5.67%
jan 1, 1989
1.745
+0.218
14.31%
jan 1, 1990
2.362
+0.617
35.39%
jan 1, 1991
2.439
+0.076
3.24%
jan 1, 1992
2.032
-0.407
-16.7%
jan 1, 1993
2.706
+0.674
33.18%
jan 1, 1994
2.516
-0.19
-7.01%
jan 1, 1995
2.184
-0.332
-13.18%
jan 1, 1996
2.254
+0.069
3.17%
jan 1, 1997
3.108
+0.855
37.92%
jan 1, 1998
2.769
-0.339
-10.9%
jan 1, 1999
2.33
-0.439
-15.87%
jan 1, 2000
2.154
-0.176
-7.56%
jan 1, 2001
3.368
+1.214
56.38%
jan 1, 2002
4.373
+1.005
29.83%
jan 1, 2003
4.58
+0.208
4.75%
jan 1, 2004
3.419
-1.161
-25.35%
jan 1, 2005
3.212
-0.207
-6.05%
jan 1, 2006
4.031
+0.819
25.48%
jan 1, 2007
4.787
+0.757
18.77%
jan 1, 2008
5.307
+0.519
10.85%
jan 1, 2009
5.286
-0.021
-0.39%
jan 1, 2010
5.495
+0.209
3.96%
jan 1, 2011
5.95
+0.455
8.28%
jan 1, 2012
6.01
+0.059
0.99%
jan 1, 2013
5.168
-0.841
-14.0%
jan 1, 2014
5.535
+0.366
7.09%
jan 1, 2015
5.091
-0.444
-8.02%
jan 1, 2016
4.739
-0.352
-6.92%
Ranking of countries by current statistics by years


Comments: