29
/
en
AIzaSyAYiBZKx7MnpbEhh9jyipgxe19OcubqV5w
April 1, 2024
264757
Togo
TGO
true
2
1
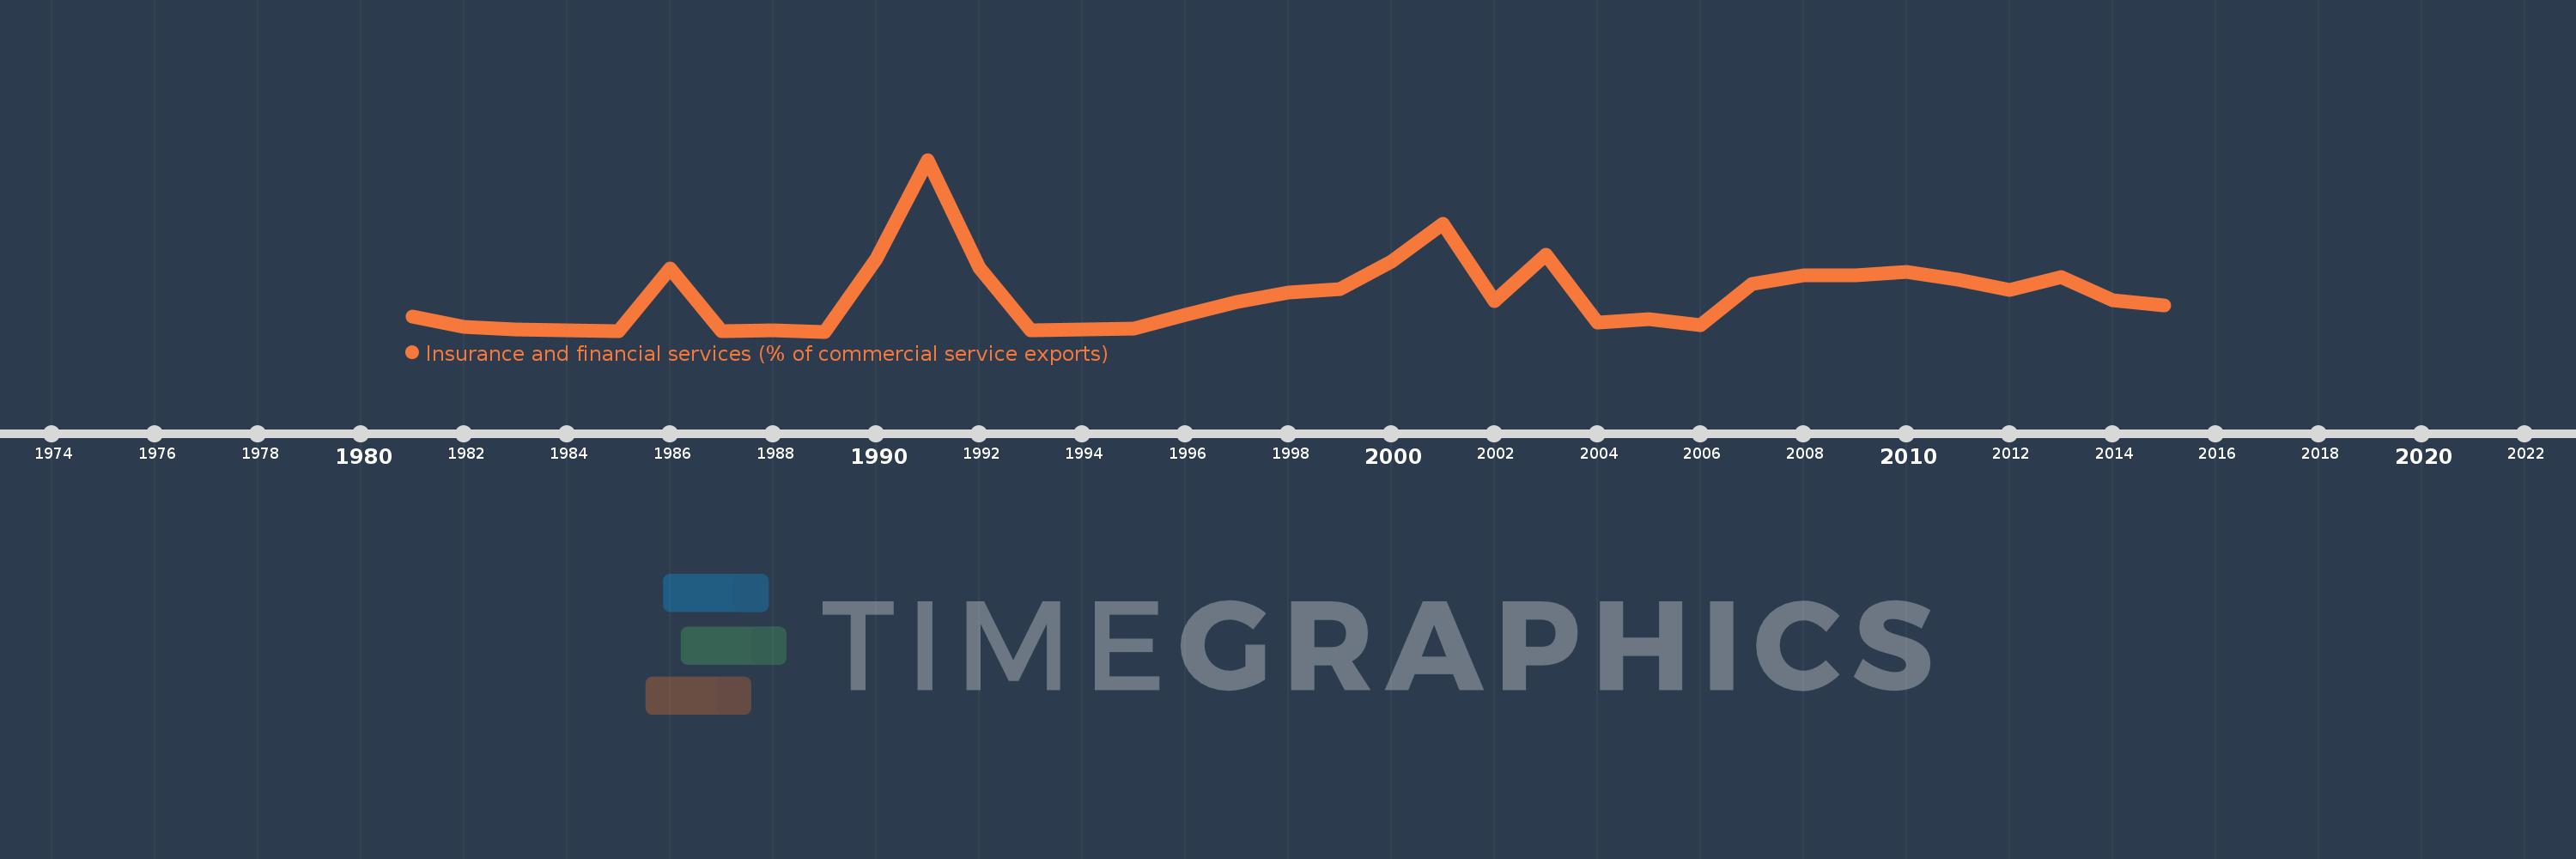
Insurance and financial services (% of commercial service exports)
2015,2014,2013,2012,2011,2010,2009,2008,2007,2006,2005,2004,2003,2002,2001,2000,1999,1998,1997,1996,1995,1994,1993,1992,1991,1990,1989,1988,1987,1986,1985,1984,1983,1982,1981
This statistics in other country:
AfghanistanAlbaniaAlgeriaAngolaAntigua and BarbudaArab WorldArgentinaArmeniaArubaAustraliaAustriaAzerbaijanBahrainBangladeshBarbadosBelarusBelgiumBelizeBeninBermudaBhutanBoliviaBosnia and HerzegovinaBotswanaBrazilBrunei DarussalamBulgariaBurkina FasoBurundiCabo VerdeCambodiaCameroonCanadaCaribbean small statesCentral African RepublicCentral Europe and the BalticsChadChileChinaColombiaComorosCongo, Dem. Rep.Congo, Rep.Costa RicaCote d'IvoireCroatiaCuracaoCyprusCzech RepublicDenmarkDominicaDominican RepublicEarly-demographic dividendEast Asia & PacificEast Asia & Pacific (excluding high income)East Asia & Pacific (IDA & IBRD countries)EcuadorEgypt, Arab Rep.El SalvadorEritreaEstoniaEthiopiaEuro areaEurope & Central AsiaEurope & Central Asia (excluding high income)Europe & Central Asia (IDA & IBRD countries)European UnionFaroe IslandsFijiFinlandFragile and conflict affected situationsFranceFrench PolynesiaGabonGambia, TheGeorgiaGermanyGhanaGreeceGrenadaGuatemalaGuineaGuinea-BissauGuyanaHaitiHeavily indebted poor countries (HIPC)High incomeHondurasHong Kong SAR, ChinaHungaryIBRD onlyIcelandIDA & IBRD totalIDA onlyIDA totalIndiaIndonesiaIran, Islamic Rep.IraqIrelandIsraelItalyJamaicaJapanJordanKazakhstanKenyaKiribatiKorea, Rep.KosovoKuwaitKyrgyz RepublicLao PDRLate-demographic dividendLatin America & Caribbean Latin America & Caribbean (excluding high income)Latin America & the Caribbean (IDA & IBRD countries)LatviaLeast developed countries: UN classificationLebanonLesothoLiberiaLibyaLithuaniaLow & middle incomeLow incomeLower middle incomeLuxembourgMacao SAR, ChinaMacedonia, FYRMadagascarMalawiMalaysiaMaldivesMaliMaltaMauritaniaMauritiusMexicoMiddle East & North AfricaMiddle East & North Africa (excluding high income)Middle East & North Africa (IDA & IBRD countries)Middle incomeMoldovaMongoliaMontenegroMoroccoMozambiqueMyanmarNamibiaNepalNetherlandsNew CaledoniaNew ZealandNicaraguaNigerNigeriaNorth AmericaNorwayOECD membersOmanOther small statesPacific island small statesPakistanPalauPanamaPapua New GuineaParaguayPeruPhilippinesPolandPortugalPost-demographic dividendPre-demographic dividendQatarRomaniaRussian FederationRwandaSamoaSao Tome and PrincipeSaudi ArabiaSenegalSerbiaSeychellesSierra LeoneSingaporeSint Maarten (Dutch part)Slovak RepublicSloveniaSmall statesSolomon IslandsSouth AfricaSouth AsiaSouth Asia (IDA & IBRD)South SudanSpainSri LankaSt. Kitts and NevisSt. LuciaSt. Vincent and the GrenadinesSub-Saharan Africa Sub-Saharan Africa (excluding high income)Sub-Saharan Africa (IDA & IBRD countries)SudanSurinameSwazilandSwedenSwitzerlandSyrian Arab RepublicTajikistanTanzaniaThailandTimor-LesteTogoTongaTrinidad and TobagoTunisiaTurkeyTuvaluUgandaUkraineUnited KingdomUnited StatesUpper middle incomeUruguayVanuatuVenezuela, RBWest Bank and GazaWorldZambiaZimbabwe Timeline:
This timeline shows a graph from 1981 to 2015 of Togo. No data until 1980. Number of actual observations by date: 35.
Source name:
World Development Indicators
Source organization:
International Monetary Fund, Balance of Payments Statistics Yearbook and data files.
Categories, topics:
Private Sector, Trade
Last updated:
apr 23, 2017
Indicators value changes by year
Maximum:
13.739
jan 1, 1991
At the date of observation
Value
Absolute change
Change from previous value
jan 1, 1981
1.676
+1.676
0.0%
jan 1, 1982
0.835
-0.841
-50.2%
jan 1, 1983
0.669
-0.165
-19.8%
jan 1, 1984
0.567
-0.103
-15.35%
jan 1, 1985
0.521
-0.045
-7.97%
jan 1, 1986
5.366
+4.844
928.97%
jan 1, 1987
0.556
-4.809
-89.63%
jan 1, 1988
0.587
+0.03
5.45%
jan 1, 1989
0.494
-0.092
-15.76%
jan 1, 1990
6.123
+5.629
1.14K%
jan 1, 1991
13.739
+7.615
124.36%
jan 1, 1992
5.402
-8.337
-60.68%
jan 1, 1993
0.567
-4.835
-89.51%
jan 1, 1994
0.648
+0.081
14.25%
jan 1, 1995
0.697
+0.05
7.7%
jan 1, 1996
1.8
+1.103
158.16%
jan 1, 1997
2.766
+0.966
53.63%
jan 1, 1998
3.498
+0.732
26.46%
jan 1, 1999
3.775
+0.277
7.92%
jan 1, 2000
5.905
+2.13
56.43%
jan 1, 2001
8.83
+2.925
49.53%
jan 1, 2002
2.818
-6.012
-68.08%
jan 1, 2003
6.443
+3.625
128.62%
jan 1, 2004
1.177
-5.266
-81.73%
jan 1, 2005
1.476
+0.299
25.41%
jan 1, 2006
0.981
-0.496
-33.57%
jan 1, 2007
4.175
+3.195
325.77%
jan 1, 2008
4.809
+0.634
15.18%
jan 1, 2009
4.864
+0.055
1.15%
jan 1, 2010
5.089
+0.224
4.61%
jan 1, 2011
4.496
-0.593
-11.65%
jan 1, 2012
3.702
-0.794
-17.66%
jan 1, 2013
4.678
+0.976
26.35%
jan 1, 2014
2.93
-1.748
-37.37%
jan 1, 2015
2.483
-0.447
-15.26%
Ranking of countries by current statistics by years


Comments: