29
/
en
AIzaSyAYiBZKx7MnpbEhh9jyipgxe19OcubqV5w
April 1, 2024
220996
Paraguay
PRY
true
2
1
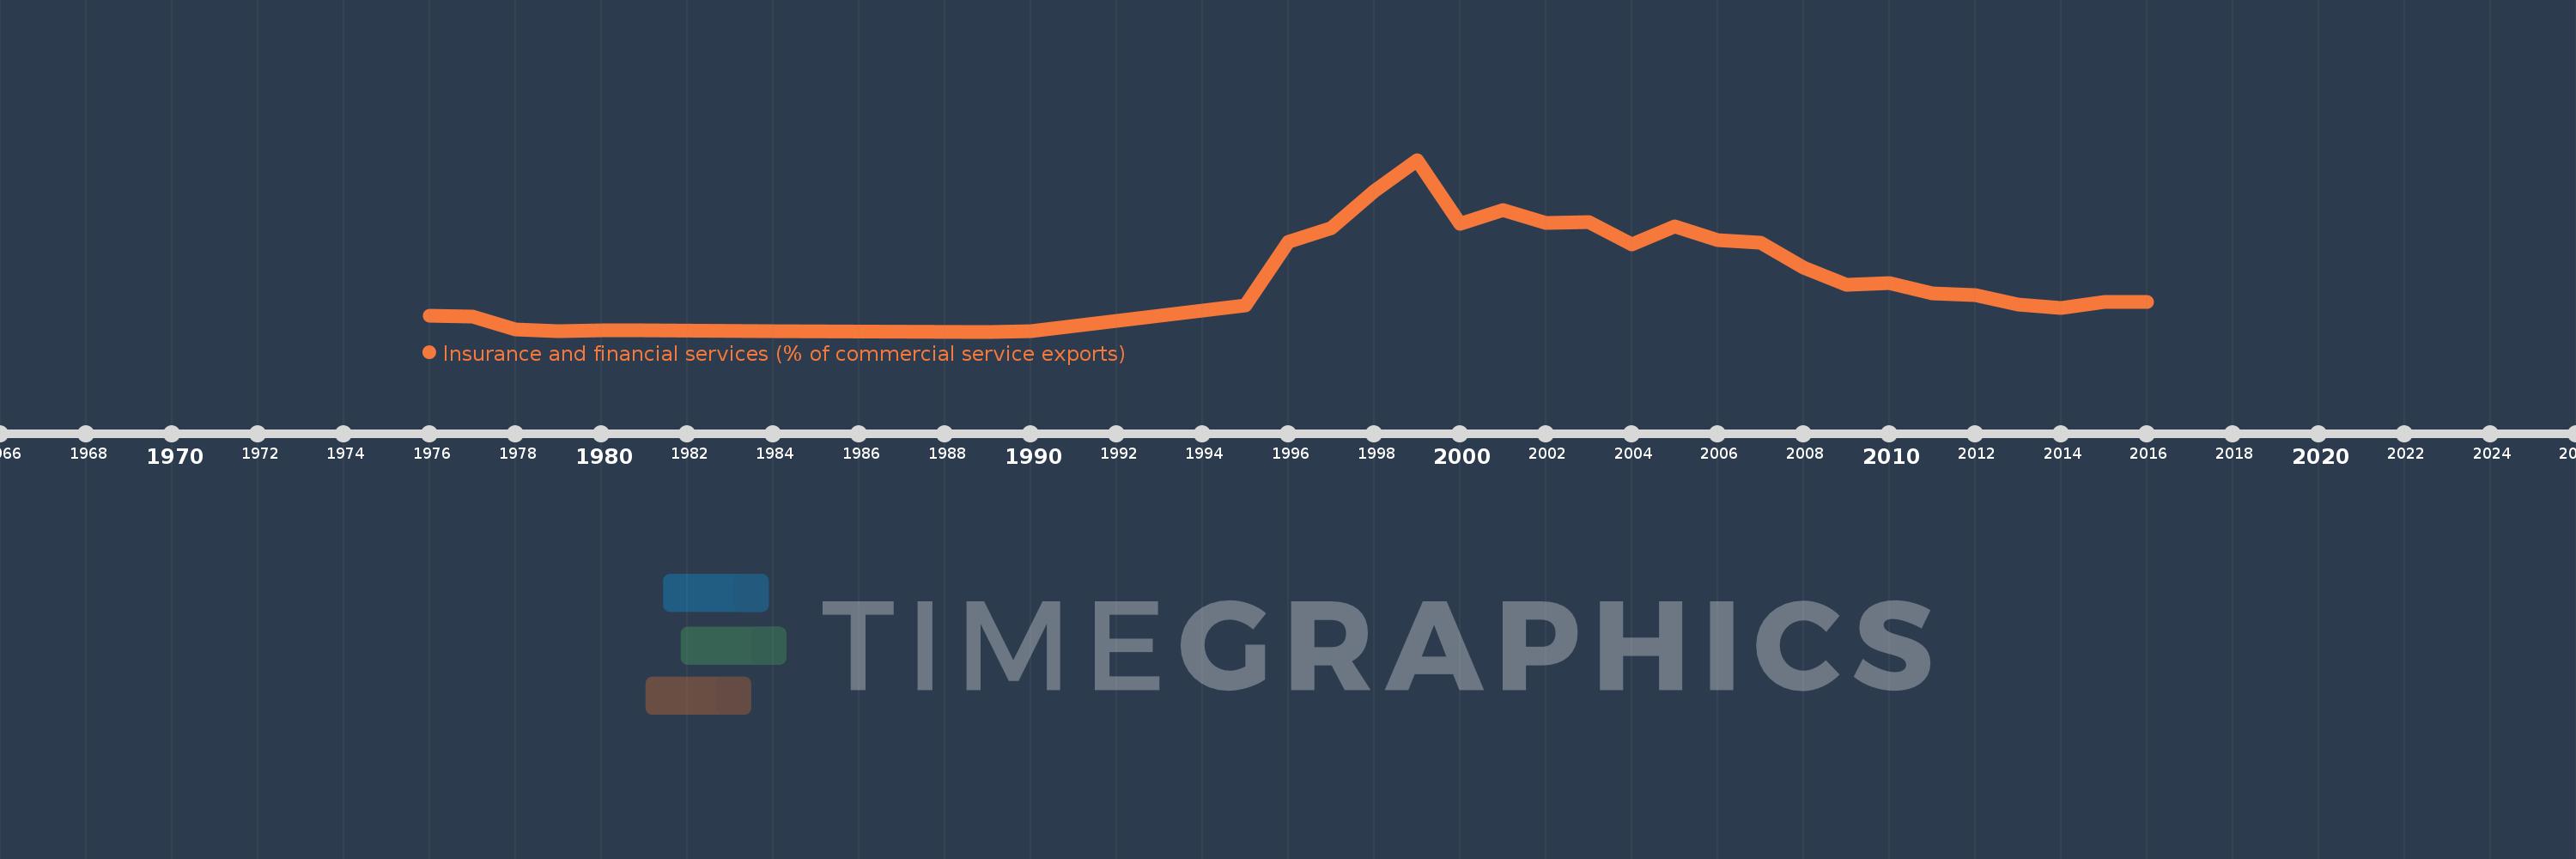
Insurance and financial services (% of commercial service exports)
2016,2015,2014,2013,2012,2011,2010,2009,2008,2007,2006,2005,2004,2003,2002,2001,2000,1999,1998,1997,1996,1995,1990,1989,1984,1981,1980,1979,1978,1977,1976
This statistics in other country:
AfghanistanAlbaniaAlgeriaAngolaAntigua and BarbudaArab WorldArgentinaArmeniaArubaAustraliaAustriaAzerbaijanBahrainBangladeshBarbadosBelarusBelgiumBelizeBeninBermudaBhutanBoliviaBosnia and HerzegovinaBotswanaBrazilBrunei DarussalamBulgariaBurkina FasoBurundiCabo VerdeCambodiaCameroonCanadaCaribbean small statesCentral African RepublicCentral Europe and the BalticsChadChileChinaColombiaComorosCongo, Dem. Rep.Congo, Rep.Costa RicaCote d'IvoireCroatiaCuracaoCyprusCzech RepublicDenmarkDominicaDominican RepublicEarly-demographic dividendEast Asia & PacificEast Asia & Pacific (excluding high income)East Asia & Pacific (IDA & IBRD countries)EcuadorEgypt, Arab Rep.El SalvadorEritreaEstoniaEthiopiaEuro areaEurope & Central AsiaEurope & Central Asia (excluding high income)Europe & Central Asia (IDA & IBRD countries)European UnionFaroe IslandsFijiFinlandFragile and conflict affected situationsFranceFrench PolynesiaGabonGambia, TheGeorgiaGermanyGhanaGreeceGrenadaGuatemalaGuineaGuinea-BissauGuyanaHaitiHeavily indebted poor countries (HIPC)High incomeHondurasHong Kong SAR, ChinaHungaryIBRD onlyIcelandIDA & IBRD totalIDA onlyIDA totalIndiaIndonesiaIran, Islamic Rep.IraqIrelandIsraelItalyJamaicaJapanJordanKazakhstanKenyaKiribatiKorea, Rep.KosovoKuwaitKyrgyz RepublicLao PDRLate-demographic dividendLatin America & Caribbean Latin America & Caribbean (excluding high income)Latin America & the Caribbean (IDA & IBRD countries)LatviaLeast developed countries: UN classificationLebanonLesothoLiberiaLibyaLithuaniaLow & middle incomeLow incomeLower middle incomeLuxembourgMacao SAR, ChinaMacedonia, FYRMadagascarMalawiMalaysiaMaldivesMaliMaltaMauritaniaMauritiusMexicoMiddle East & North AfricaMiddle East & North Africa (excluding high income)Middle East & North Africa (IDA & IBRD countries)Middle incomeMoldovaMongoliaMontenegroMoroccoMozambiqueMyanmarNamibiaNepalNetherlandsNew CaledoniaNew ZealandNicaraguaNigerNigeriaNorth AmericaNorwayOECD membersOmanOther small statesPacific island small statesPakistanPalauPanamaPapua New GuineaParaguayPeruPhilippinesPolandPortugalPost-demographic dividendPre-demographic dividendQatarRomaniaRussian FederationRwandaSamoaSao Tome and PrincipeSaudi ArabiaSenegalSerbiaSeychellesSierra LeoneSingaporeSint Maarten (Dutch part)Slovak RepublicSloveniaSmall statesSolomon IslandsSouth AfricaSouth AsiaSouth Asia (IDA & IBRD)South SudanSpainSri LankaSt. Kitts and NevisSt. LuciaSt. Vincent and the GrenadinesSub-Saharan Africa Sub-Saharan Africa (excluding high income)Sub-Saharan Africa (IDA & IBRD countries)SudanSurinameSwazilandSwedenSwitzerlandSyrian Arab RepublicTajikistanTanzaniaThailandTimor-LesteTogoTongaTrinidad and TobagoTunisiaTurkeyTuvaluUgandaUkraineUnited KingdomUnited StatesUpper middle incomeUruguayVanuatuVenezuela, RBWest Bank and GazaWorldZambiaZimbabwe Timeline:
This timeline shows a graph from 1976 to 2016 of Paraguay. No data until 1975. Number of actual observations by date: 31.
Source name:
World Development Indicators
Source organization:
International Monetary Fund, Balance of Payments Statistics Yearbook and data files.
Categories, topics:
Private Sector, Trade
Last updated:
apr 23, 2017
Indicators value changes by year
Maximum:
21.201
jan 1, 1999
At the date of observation
Value
Absolute change
Change from previous value
jan 1, 1976
1.993
+1.993
0.0%
jan 1, 1977
1.961
-0.033
-1.63%
jan 1, 1978
0.342
-1.618
-82.53%
jan 1, 1979
0.136
-0.206
-60.16%
jan 1, 1980
0.243
+0.106
77.91%
jan 1, 1981
0.19
-0.053
-21.82%
jan 1, 1984
0.075
-0.115
-60.61%
jan 1, 1989
0.07
-0.005
-6.4%
jan 1, 1990
0.078
+0.008
11.71%
jan 1, 1995
3.283
+3.205
4.1K%
jan 1, 1996
11.115
+7.832
238.57%
jan 1, 1997
12.84
+1.724
15.51%
jan 1, 1998
17.319
+4.479
34.88%
jan 1, 1999
21.201
+3.882
22.42%
jan 1, 2000
13.304
-7.897
-37.25%
jan 1, 2001
14.976
+1.672
12.57%
jan 1, 2002
13.455
-1.522
-10.16%
jan 1, 2003
13.516
+0.061
0.45%
jan 1, 2004
10.779
-2.736
-20.25%
jan 1, 2005
13.063
+2.284
21.19%
jan 1, 2006
11.311
-1.752
-13.42%
jan 1, 2007
11.027
-0.284
-2.51%
jan 1, 2008
7.906
-3.121
-28.3%
jan 1, 2009
5.868
-2.037
-25.77%
jan 1, 2010
6.005
+0.137
2.34%
jan 1, 2011
4.78
-1.225
-20.4%
jan 1, 2012
4.52
-0.26
-5.44%
jan 1, 2013
3.403
-1.118
-24.72%
jan 1, 2014
3.005
-0.398
-11.7%
jan 1, 2015
3.69
+0.686
22.82%
jan 1, 2016
3.668
-0.022
-0.59%
Ranking of countries by current statistics by years


Comments: